

Mathematics, 03.08.2020 14:01, julie47d
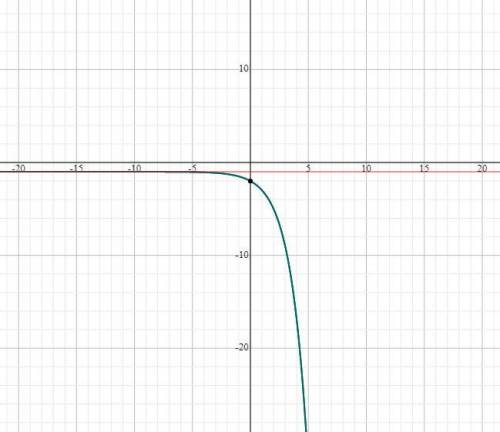
Which of the following shows the graph of y = –(2)x – 1? On a coordinate plane, a curve is level at y = 0 in quadrant 2 and then decreases rapidly into quadrant 4. It crosses the y-axis at (0, negative 0.5). On a coordinate plane, a curve is level at y = negative 1 in quadrant 3 and then decreases rapidly into quadrant 4. It crosses the y-axis at (0, negative 2). On a coordinate plane, a curve is level at y = 1 in quadrant 3 and then decreases rapidly into quadrant 4. It crosses the y-axis at (0, 0).

Answers: 1


Other questions on the subject: Mathematics
Mathematics, 21.06.2019 18:00, evarod
The given dot plot represents the average daily temperatures, in degrees fahrenheit, recorded in a town during the first 15 days of september. if the dot plot is converted to a box plot, the first quartile would be drawn at __ , and the third quartile would be drawn at link to the chart is here
Answers: 1
Mathematics, 21.06.2019 20:00, PastryCrisp
The function f(x) = 14,600(1.1)* represents the population of a town x years after it was established. what was the original population of the town?
Answers: 1
Do you know the correct answer?
Which of the following shows the graph of y = –(2)x – 1? On a coordinate plane, a curve is level at...
Questions in other subjects:

Mathematics, 21.04.2021 15:20


Biology, 21.04.2021 15:20
Mathematics, 21.04.2021 15:20

English, 21.04.2021 15:20


