


Which inequality is shown in this graph?
(0, 2) (-1,-2)
a) y>=-4x+2
b) y>=4...

Mathematics, 03.08.2020 14:01, u8p4
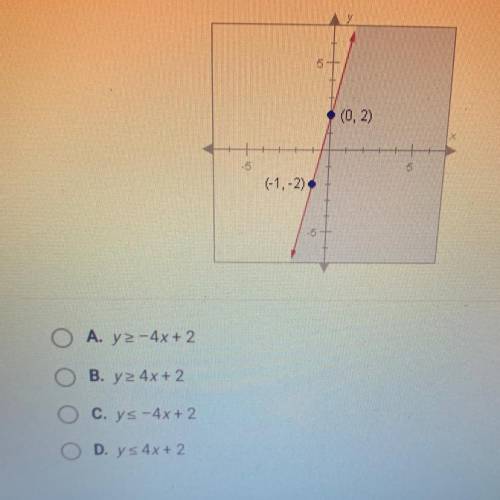
Which inequality is shown in this graph?
(0, 2) (-1,-2)
a) y>=-4x+2
b) y>=4x+2
c) y<=-4x+2
d) y<=4x+2

Answers: 2
Other questions on the subject: Mathematics
Mathematics, 21.06.2019 14:30, smith3mgy
Simonne used the following steps to simplify the given expression. 12 - 3(-2x + 4) step 1: 12 + (–3)·(–2x) + (–3)·(4) step 2: 12 + 6x + (–12) step 3: 12 + (–12) + 6x step 4: 0 + 6x step 5: 6x what property of real numbers was used to transition from step 3 to step 4? a. identity property of addition b. inverse property of addition c. associative property of addition d. commutative property of addition
Answers: 1
Mathematics, 21.06.2019 22:10, laurenbreellamerritt
On a piece of paper, graph y< x-1. then determine which answer choicematches the graph you drew.13. z3. 2(3.290-1)
Answers: 2
Do you know the correct answer?
Questions in other subjects:


Mathematics, 07.09.2021 01:00

History, 07.09.2021 01:00
English, 07.09.2021 01:00


