

Mathematics, 30.07.2020 21:01, rainbowboi
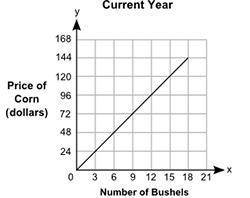
HELP PLEASE 30 POINTS The graph shows the prices of different numbers of bushels of corn at a store in the current year. The table shows the prices of different numbers of bushels of corn at the same store in the previous year. A graph shows Number of Bushels on x-axis and Price of Corn in dollars on y-axis. The x-axis scale is shown from 0 to 21 at increments of 3, and the y-axis scale is shown from 0 to 168 at increments of 24. A straight line joins the ordered pairs 3, 24 and 6, 48 and 9, 72 and 12, 96 and 15, 120 and 18, 144. Previous Year Number of Bushels Price of Corn (dollars) 3 21 6 42 9 63 12 84 Part A: Describe in words how you can find the rate of change of a bushel of corn in the current year, and find the value. Part B: How many dollars more is the price of a bushel of corn in the current year than the price of a bushel of corn in the previous year? Show your work.

Answers: 1


Other questions on the subject: Mathematics
Mathematics, 21.06.2019 13:50, talahtoo6659
Is every rectangle is a parallelogram? true false
Answers: 2
Mathematics, 21.06.2019 16:30, RoyalGurl01
Gail is making costumes for a school play. each rabbit costume needs one and one half yards of white fur fabric, a yard of blue striped fabric, and a quarter of a yard of pink felt for the ears. g? ail needs to make eight rabbit man yards will she need, for the white fur fabric, blue striped fabric, and pink felt?
Answers: 1
Do you know the correct answer?
HELP PLEASE 30 POINTS The graph shows the prices of different numbers of bushels of corn at a store...
Questions in other subjects:

Social Studies, 09.12.2019 10:31


History, 09.12.2019 10:31
Mathematics, 09.12.2019 10:31


