

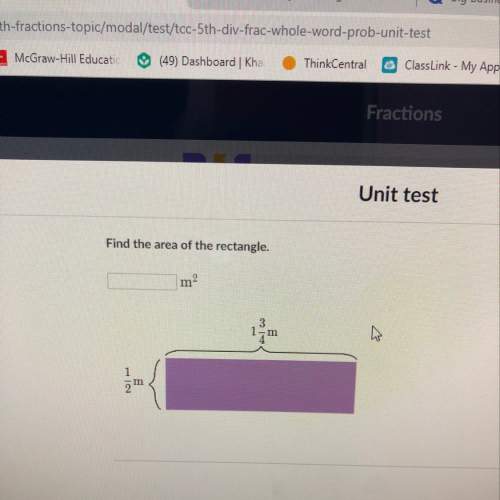
Mathematics, 29.07.2020 03:01, skyebrockbank
The data below represent the length (in miles) of a random sample of tornadoes in a specific area. This length represents the number of miles a particular tornado was on the ground.
table of tornado lengths
1.14
8.70
2.48
1.15
0.48
3.30
5.09
0.48
1.32
2.20
0.88
1.83
1.88
6.35
3.39
7.97
0.16
0.10
0.11
0.11
0.50
4.72
0.52
21.19
22.80
2.06
0.20
7.12
13.97
14.52
1.04
3.87
6.28
4.67
6.23
1.25
10.34
2.03
9.04
8.57
2.58
5.84
7.61
6.04
0.68
8.43
0.83
1.71
0.20
0.10
0.73
0.27
0.70
1.56
3.46
8.90
0.39
0.10
0.41
0.10
0.10
0.63
2.18
5.65
0.96
0.33
0.51
0.51
0.10
4.93
2.53
1.24
5.93
0.49
1.13
0.52
1.05
0.20
1.13
3.33
4.63
1.81
3.68
0.10
0.12
(a) Comment on the shape of the histogram. Choose the correct answer below.
A. The histogram is skewed left.
B. The histogram is symmetric and bell-shaped.
C. The histogram is uniform.
D. The histogram is skewed right.
(b) Are there outliers?
A. Yes, because there are several values that are more extreme than Q1 or Q99.
B. No, because there are no values that fall at least 1.5(IQR) outside of Q1 or Q3.
C. Yes, because there are several values that fall at least 1.5(IQR) outside of Q1 or Q3.
D. No, because there are no values that are more extreme than Q1 or Q99.
(c) Based on the results to parts (a) and(b), explain why a large sample size might be desirable to construct a confidence interval for the mean length of a tornado in this area. Choose the correct answer below.
A. The results to parts (a) and (b) indicate that the underlying population is non-normal. Such populations require large sample sizes to construct valid confidence intervals.
B. The results to parts (a) and (b) indicate that the underlying population is normal. Such populations require large sample sizes to construct valid confidence intervals.
C. The results to parts (a) and (b) indicate that the sample data are not independent. Dependent samples require large sample sizes to construct valid confidence intervals.
D. The results to parts (a) and (b) indicate that the sample size is small relative to the population size. Sample sizes must be large relative to the population size to construct valid confidence intervals.
(d) Use statistical software to construct a 90% confidence interval for the mean tornado length. Select the correct choice below and fill in the answer boxes to complete your choice.
(Use ascending order. Round to two decimal places asneeded.)
A. There is 90% probability that the true mean length of a tornado is between __?__miles and __?__miles.
B. If repeated samples are taken,90% of them will have a sample mean between __?__miles and __?__miles.
C. We are 90% confident that the population mean length of a tornado is between __?__miles and __?__miles.

Answers: 3


Other questions on the subject: Mathematics
Mathematics, 21.06.2019 20:30, qveenvslayin
Erin bought christmas cards for $2 each to send to her family and friends. which variable is the dependent variable?
Answers: 1
Mathematics, 21.06.2019 21:00, trinitymarielouis
How do you write y-10=2 (x-8) in standard form
Answers: 1
Do you know the correct answer?
The data below represent the length (in miles) of a random sample of tornadoes in a specific area. T...
Questions in other subjects:


Business, 25.11.2020 15:20

English, 25.11.2020 15:20
Mathematics, 25.11.2020 15:20
History, 25.11.2020 15:20

Social Studies, 25.11.2020 15:20
Mathematics, 25.11.2020 15:20

Spanish, 25.11.2020 15:20

Biology, 25.11.2020 15:20


