


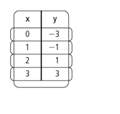
Which equation represents the relationship shown in the table below?
a. y = –x – 3
b. y...

Mathematics, 28.08.2019 13:00, GamerGirl15
Which equation represents the relationship shown in the table below?
a. y = –x – 3
b. y = x – 3
c. y = 2x − 3
d. y = –2x + 3

Answers: 2
Other questions on the subject: Mathematics
Mathematics, 21.06.2019 21:00, kprincess16r
Choose the equation below that represents the line that passes through the point (2, 4) and has a slope of 3. a) y − 4 = 3(x − 2) b) y − 2 = 3(x − 4) c) y + 4 = 3(x + 2) d) y + 2 = 3(x + 4)
Answers: 1
Do you know the correct answer?
Questions in other subjects:
Mathematics, 02.02.2021 08:50

Social Studies, 02.02.2021 08:50


History, 02.02.2021 08:50

Health, 02.02.2021 08:50


