


HIME REMAINING
01:16:21
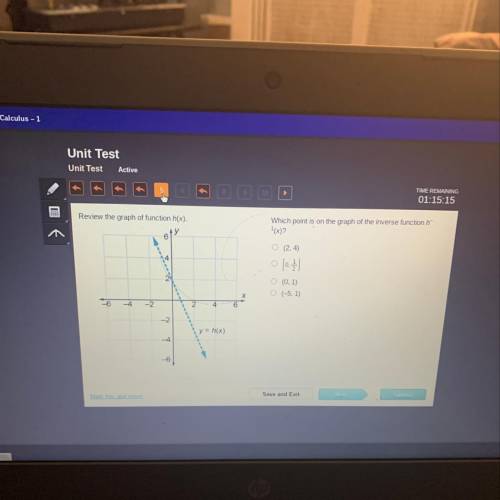
Review the graph of function h(x).
Which point is on the graph...

Mathematics, 26.07.2020 01:01, Tok
HIME REMAINING
01:16:21
Review the graph of function h(x).
Which point is on the graph of the inverse function h
(x)?
O (2, 4)
o (0,1
0 (0, 1)
o (-5, 1)
Х
6
-4
24
-2
y = h(x)
-4
Save and Exit

Answers: 3
Other questions on the subject: Mathematics
Mathematics, 21.06.2019 17:00, KHaire2077
In a sample of 2023 u. s. adults, 373 said franklin roosevelt was the best president since world war ii. two u. s. adults are selected at random from the population of all u. s. adults without replacement. assuming the sample is representative of all u. s. adults, complete parts (a) through (d). (a) find the probability that both adults say franklin roosevelt was the best president since world war ii. the probability that both adults say franklin roosevelt was the best president since world war ii is (round to three decimal places as needed.) (b) find the probability that neither adult says franklin roosevelt was the best president since world war ii. the probability that neither adult says franklin roosevelt was the best president since world war ii is (round to three decimal places as needed.) (c) find the probability that at least one of the two adults says franklin roosevelt was the best president since world war ii. the probability that at least one of the two adults says franklin roosevelt was the best president since world war ii is (round to three decimal places as needed.) (d) which of the events can be considered unusual? explain. select all that apply. the event in part left parenthesis a right parenthesis is unusual because its probability is less than or equal to 0.05. the event in part (b) is unusual because its probability is less than or equal to 0.05. none of these events are unusual. the event in part (c) is unusual because its probability is less than or equal to 0.05.
Answers: 3
Mathematics, 21.06.2019 17:10, ivilkas23
The frequency table shows a set of data collected by a doctor for adult patients who were diagnosed with a strain of influenza. patients with influenza age range number of sick patients 25 to 29 30 to 34 35 to 39 40 to 45 which dot plot could represent the same data as the frequency table? patients with flu
Answers: 2
Mathematics, 21.06.2019 19:00, mustafajibawi1
Eis the midpoint of line segment ac and bd also line segment ed is congruent to ec prove that line segment ae is congruent to line segment be
Answers: 3
Mathematics, 21.06.2019 20:00, naimareiad
Ialready asked this but i never got an answer. will give a high rating and perhaps brainliest. choose the linear inequality that describes the graph. the gray area represents the shaded region. y ≤ –4x – 2 y > –4x – 2 y ≥ –4x – 2 y < 4x – 2
Answers: 1
Do you know the correct answer?
Questions in other subjects:

Physics, 25.08.2019 11:30

Social Studies, 25.08.2019 11:30
Mathematics, 25.08.2019 11:30
Mathematics, 25.08.2019 11:30

Biology, 25.08.2019 11:30

Business, 25.08.2019 11:30

History, 25.08.2019 11:30
History, 25.08.2019 11:30
Mathematics, 25.08.2019 11:30


