

Mathematics, 24.07.2020 01:01, pickettkunisha14
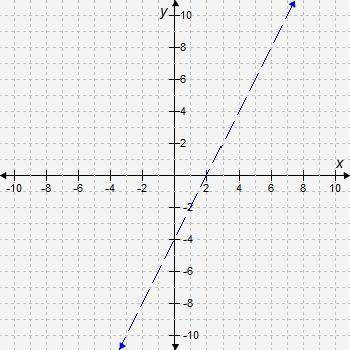
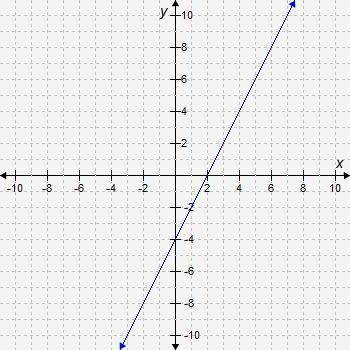
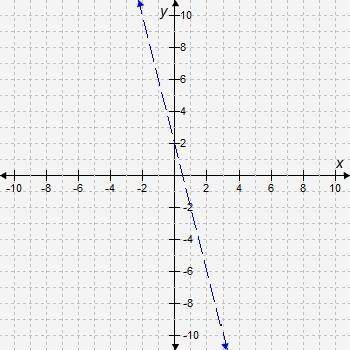
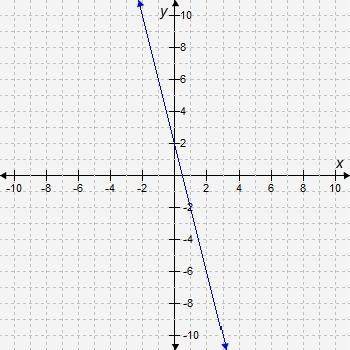
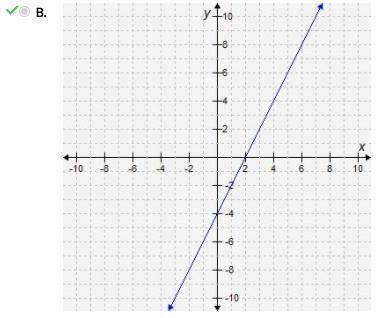
When graphing the inequality y ≤ 2x − 4, the boundary line needs to be graphed first. Which graph correctly shows the boundary line? A.) Picture 1 B.) Picture 2 C.) Picture 3 D.) Picture 4

Answers: 3


Other questions on the subject: Mathematics
Mathematics, 21.06.2019 15:30, nicpinela1234
The coordinates of a, b, and c in the diagram are a(p,4), b(6,1), and c(9,q). which equation correctly relates p and q? hint: since is perpendicular to , the slope of × the slope of = -1. a. p - q = 7 b. q - p = 7 c. -q - p = 7 d. p + q = 7
Answers: 3
Mathematics, 21.06.2019 15:50, kendallreed39
3-12. write each answer with a reasonable number of figures. find the absolute uncertainty and percent relative uncertainty for each answer. (a) [12.41 (±0.09) + 4.16 (±0.01)] x 7.068 2 (±0.000 4) =? (b) [3.26 (±0.10) x 8.47 (±0.05)] - 0.18 (±0.06) =? (c) 6.843 (±0.008) x 104 + [2.09 (±0.04)- 1.63 (±0.01)] =?
Answers: 1
Mathematics, 21.06.2019 22:30, lamooothegoat
The pair of coordinates that do not represent the point( 5,150’) is a. (5,-210) b. (5,210) c. (-5,330) d. (-5,-30)
Answers: 1
Mathematics, 22.06.2019 00:50, jasmine77723
How does the graph of y = 3x compare to the graph of y = 3-x?
Answers: 1
Do you know the correct answer?
When graphing the inequality y ≤ 2x − 4, the boundary line needs to be graphed first. Which graph co...
Questions in other subjects:
Mathematics, 06.06.2021 04:10

Mathematics, 06.06.2021 04:10

Mathematics, 06.06.2021 04:10
Mathematics, 06.06.2021 04:10

World Languages, 06.06.2021 04:10


