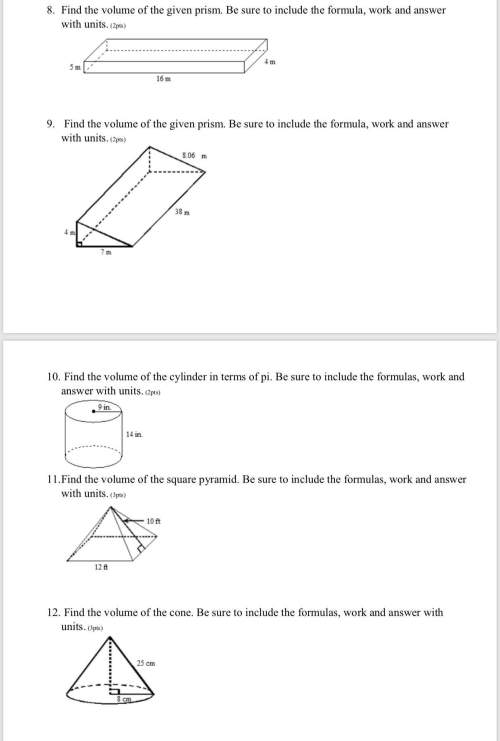
Which inequality is represented by this graph?
10
(0.1) (6.0)
-10
-107
O A. ys-...

Mathematics, 24.07.2020 23:01, egirl31
Which inequality is represented by this graph?
10
(0.1) (6.0)
-10
-107
O A. ys-*x+1
B. y< -*x+1
C. y>-x+1
D. 12-x+1

Answers: 1
Other questions on the subject: Mathematics

Mathematics, 21.06.2019 17:50, MrKrinkle77
Segment ab is shown on the graph. which shows how to find the x-coordinate of the point that will divide ab into a 2: 3 ratio using the formula
Answers: 2

Mathematics, 21.06.2019 22:00, blythephillips2734
Benjamin is making bow ties. how many 1/2yards lomg bow ties can he make if he has 18 feet of fabric?
Answers: 2

Mathematics, 22.06.2019 00:30, steelersfan4343
Which of these side lengths could form a triangle a) 2 cm , 2 cm , 4 cm b) 3 cm , 5 cm , 10 cm c) 3 cm , 4 cm , 5 cm d) 4 cm , 8 cm , 15 cm
Answers: 3
Do you know the correct answer?
Questions in other subjects:

Mathematics, 14.09.2020 16:01

English, 14.09.2020 16:01

English, 14.09.2020 16:01

Mathematics, 14.09.2020 16:01

Mathematics, 14.09.2020 16:01

Social Studies, 14.09.2020 16:01

History, 14.09.2020 16:01

Mathematics, 14.09.2020 16:01

Mathematics, 14.09.2020 16:01

Mathematics, 14.09.2020 16:01


