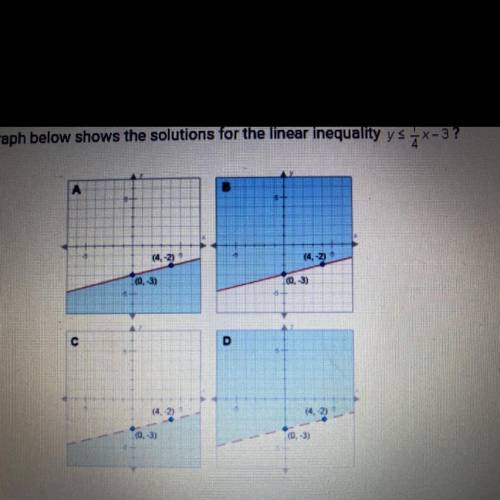
Graph A.
Step-by-step explanation:
Given the inequality: 
Since the sign is "less than or equal to", the line cannot be dotted. Therefore, Options C and D are incorrect.
Since the sign is a "less than" sign, the required region must be below the line. Therefore, the graph which shows the given inequality is Graph A.