

Mathematics, 23.07.2020 22:01, ehsket
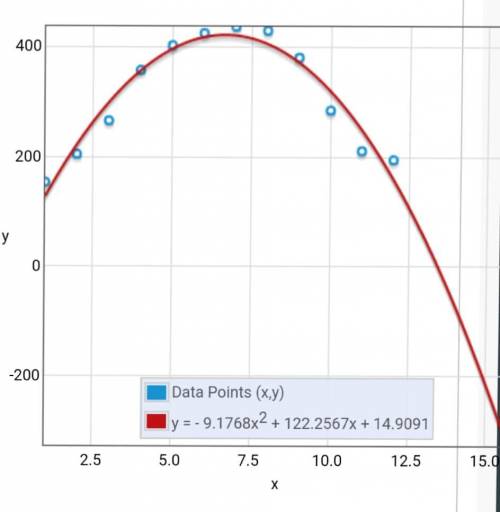
The table represents the average daily price of a two-bedroom beachfront condo each month, with January represented as month 1, February as month 2, and so on. Month (x) Daily Rental Price (y) 1 $154 2 $205 3 $266 4 $358 5 $403 6 $425 7 $437 8 $430 9 $381 10 $285 11 $211 12 $195 Use the graphing tool to determine the curve of best fit for this data. Write the equation of the curve in the space below.

Answers: 3


Other questions on the subject: Mathematics
Mathematics, 21.06.2019 15:00, cartizeb23
Simplify (a/b - b/a) times (a - a^2/a+b) a - a^2/a=b is a mixed number
Answers: 2
Mathematics, 21.06.2019 18:00, jeffylovesgreenbeans
Adj has a total of 1075 dance and rock songs on her system. the dance selection is 4 times the size of the rock selection. write a system of equations to represent the situation.
Answers: 1
Do you know the correct answer?
The table represents the average daily price of a two-bedroom beachfront condo each month, with Janu...
Questions in other subjects:


Advanced Placement (AP), 20.08.2019 01:30


Computers and Technology, 20.08.2019 01:30


Computers and Technology, 20.08.2019 01:30


