

Mathematics, 23.07.2020 03:01, maddieg5585
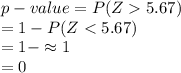
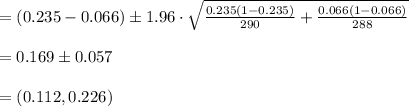
A study was conducted to determine the proportion of people who dream in black and white instead of color. Among 290 people over the age of 55, 68 dream in black and white and among 288 people under the age of 25, 19 dream in black and white. Use a 0.05 significance level to test the claim that the proportion of people over 55 who dream in black and white is greater than the proportion of those underIdentify the test statistic?Identify the p value?Test the claim by constructing an appropriate confidence level?What is the conclusion base on the hypothesis test?What is the conclusion base on the confidence level?

Answers: 1
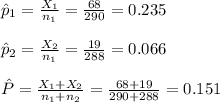
![z=\frac{\hat p_{1}-\hat p_{2}}{\sqrt{\hat P(1-\hat P)[\frac{1}{n_{1}}+\frac{1}{n_{2}}]}}](/tpl/images/0711/5954/332c3.png)
![=\frac{0.235-0.066}{\sqrt{0.151(1-0.151)[\frac{1}{290}+\frac{1}{288}]}}\\\\=5.67](/tpl/images/0711/5954/6731d.png)


Other questions on the subject: Mathematics
Mathematics, 21.06.2019 18:30, rachel2735
Can someone check if i did this right since i really want to make sure it’s correct. if you do you so much
Answers: 1
Do you know the correct answer?
A study was conducted to determine the proportion of people who dream in black and white instead of...
Questions in other subjects:
Mathematics, 25.05.2021 23:30

History, 25.05.2021 23:30
Mathematics, 25.05.2021 23:30

Mathematics, 25.05.2021 23:30


