

Mathematics, 22.07.2020 19:01, jadalawler3
The graph shows the distance a car traveled, y, in x hours: A coordinate plane graph is shown. The x-axis is labeled time in hours, and the y-axis is labeled distance in miles. The line passes through the points 1 comma 35, 2 comma 70, and 3 comma 105. What is the rise-over-run value for the relationship represented in the graph?

Answers: 3


Other questions on the subject: Mathematics
Mathematics, 21.06.2019 21:10, cheyennemitchel238
What is the equation of a line passing through (-6,5) and having a slope of 1/3
Answers: 3
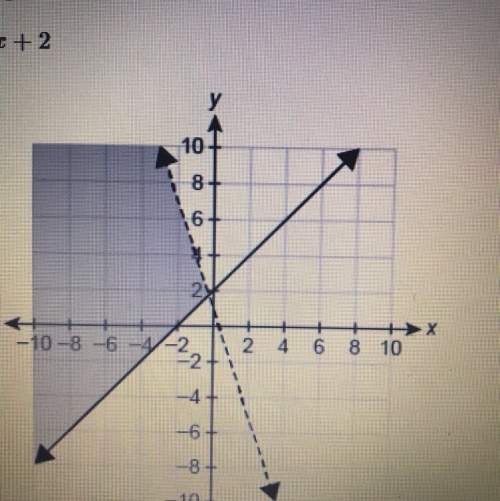
Mathematics, 21.06.2019 22:50, sarbjit879
Which linear inequality is represented by the graph?
Answers: 1
Do you know the correct answer?
The graph shows the distance a car traveled, y, in x hours: A coordinate plane graph is shown. The x...
Questions in other subjects:

Mathematics, 04.05.2020 22:40


Chemistry, 04.05.2020 22:40


