

Mathematics, 21.07.2020 01:01, dajahj27
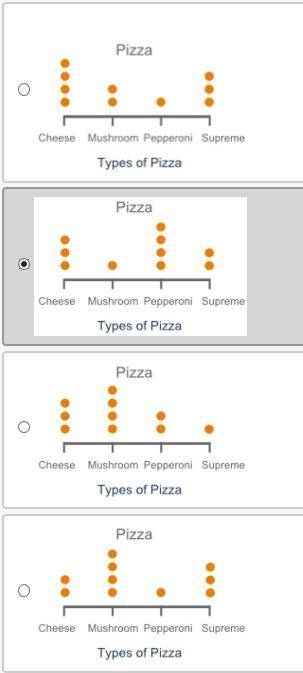
Patricia recorded the different types of pizza her friends like in the table below: Pizza Type Number of Friends Cheese 3 Mushroom 1 Pepperoni 4 Supreme 2 Which of the following plots represents the data in the table?

Answers: 1


Other questions on the subject: Mathematics
Mathematics, 21.06.2019 16:00, ramirezzairap2u4lh
Data are collected to see how many ice-cream cones are sold at a ballpark in a week. day 1 is sunday and day 7 is the following saturday. use the data from the table to create a scatter plot.
Answers: 2
Do you know the correct answer?
Patricia recorded the different types of pizza her friends like in the table below: Pizza Type Numbe...
Questions in other subjects:


Biology, 17.02.2022 15:20


