


Hurrryy plzzz!!
Which linear inequality is represented by the graph?
y<1/2x+2
y>1...

Mathematics, 17.07.2020 14:01, jessica6597
Hurrryy plzzz!!
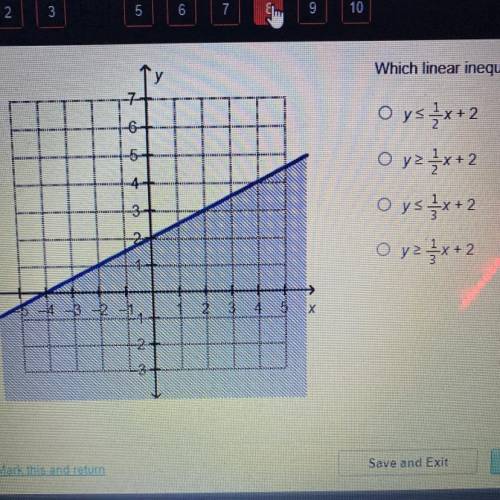
Which linear inequality is represented by the graph?
y<1/2x+2
y>1/2x+2
y<1/3x+2
y>1/3x+2

Answers: 2
Other questions on the subject: Mathematics
Mathematics, 21.06.2019 18:00, kezin
The sat and act tests use very different grading scales. the sat math scores follow a normal distribution with mean 518 and standard deviation of 118. the act math scores follow a normal distribution with mean 20.7 and standard deviation of 5. suppose regan scores a 754 on the math portion of the sat. how much would her sister veronica need to score on the math portion of the act to meet or beat regan's score?
Answers: 1
Mathematics, 21.06.2019 18:30, mstrish71oteauw
Two angles are complementary. the large angle is 36 more than the smaller angle. what is the measure of the large angle?
Answers: 1
Mathematics, 22.06.2019 01:00, sawyerharper
The price for gasoline is represented by the equation y=3.69x, where y represents the total price for x gallons of gasoline. on a graph, the number of gallons is represented on the horizontal axis, and the total price is represented on the vertical axis. determine whether each statement describes the graph of the equation. select true or false for each statement
Answers: 2
Do you know the correct answer?
Questions in other subjects:

Biology, 05.11.2019 01:31
Biology, 05.11.2019 01:31


Spanish, 05.11.2019 01:31


Geography, 05.11.2019 01:31
Mathematics, 05.11.2019 01:31


