

Mathematics, 18.07.2020 06:01, carcon2019
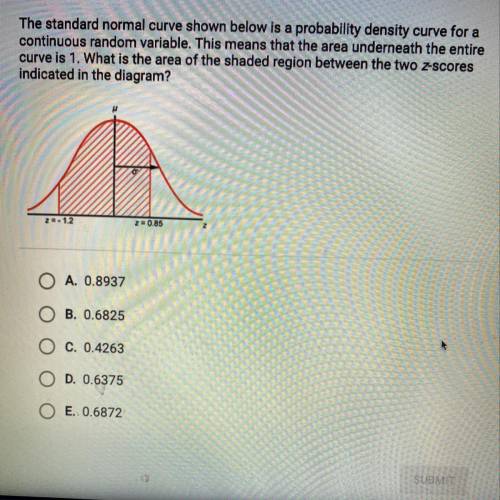
The standard normal curve shown below is a probability density curve for a
continuous random variable. This means that the area underneath the entire
curve is 1. What is the area of the shaded region between the two z-scores
indicated in the diagram? z=-1.2 z=0.85
A.0.8937
B.0.6825
C.0.4263
D.0.6375
E.0.6872

Answers: 1


Other questions on the subject: Mathematics
Mathematics, 21.06.2019 13:00, jlluminate91671
Sal is tiling his entryway. the floor plan is drawn on a unit grid. each unit length represents 1 foot. tile costs $1.35 per square foot. how much will sal pay to tile his entryway? round your answer to the nearest cent.
Answers: 2
Mathematics, 21.06.2019 22:00, marissastewart533
Given sin∅ = 1/3 and 0 < ∅ < π/2 ; find tan2∅ a. (4√2)/9 b. 9/7 c. (4√2)/7 d.7/9
Answers: 2
Do you know the correct answer?
The standard normal curve shown below is a probability density curve for a
continuous random variab...
Questions in other subjects:

History, 20.02.2021 06:00

English, 20.02.2021 06:00
Mathematics, 20.02.2021 06:00
Mathematics, 20.02.2021 06:00
Mathematics, 20.02.2021 06:00
Mathematics, 20.02.2021 06:00
Mathematics, 20.02.2021 06:00

Business, 20.02.2021 06:00


