

Mathematics, 17.07.2020 01:01, nisha87
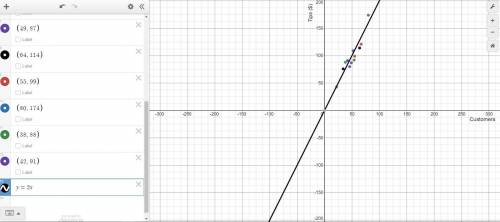
You and your business partner track the number of customers served and the amount of tips collected per day. The data you gathered is displayed in the chart below. Servers’ Collected Tips Customers 54 46 34 67 52 22 49 64 55 80 38 42 Tips ($) $92 $80 $76 $121 $109 $43 $87 $114 $99 $174 $88 $91 a) Create a scatterplot displaying the data in the table. Be sure to include a linear trend line

Answers: 2


Other questions on the subject: Mathematics
Mathematics, 21.06.2019 17:00, joylsbarbour
The ratio of rock songs to dance songs on jonathan’s mp3 player is 5: 6. the total number of rock and dance songs jonathan has is between 101 120. how many rock songs does he have?
Answers: 2
Mathematics, 21.06.2019 17:40, faithtunison
Aline has a slope of and a y-intercept of –2. what is the x-intercept of the line?
Answers: 1
Do you know the correct answer?
You and your business partner track the number of customers served and the amount of tips collected...
Questions in other subjects:


Computers and Technology, 01.04.2021 04:50
Mathematics, 01.04.2021 04:50

Mathematics, 01.04.2021 04:50

Chemistry, 01.04.2021 04:50
Mathematics, 01.04.2021 04:50


