


Which linear inequality is represented by the graph?
Oy<3x + 2
O y> 3x + 2
O y =...

Mathematics, 17.07.2020 08:01, ratpizza
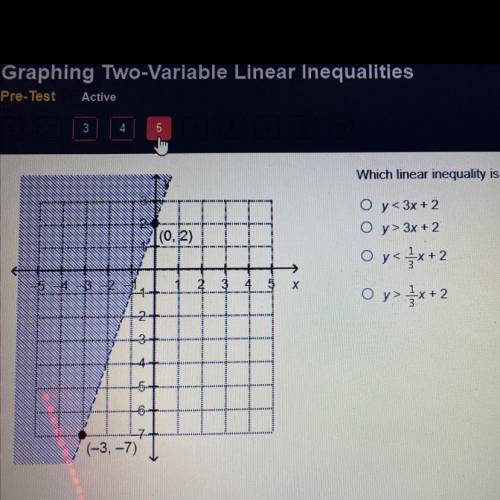
Which linear inequality is represented by the graph?
Oy<3x + 2
O y> 3x + 2
O y = <1/3 x + 2
O y> 1 /3x + 2

Answers: 3
Other questions on the subject: Mathematics
Mathematics, 21.06.2019 16:00, dtovar4922
Apatient is to take 60 mg of an antibiotic on day 1, take 45mg on days 2 and 3, take 30mg on days 4 and 5 and take 15 mg on days 6 and 7. how many total mg will the patient take?
Answers: 1
Mathematics, 21.06.2019 16:10, deannabrown2293
The box plot shows the number of raisins found in sample boxes from brand c and from brand d. each box weighs the same. what could you infer by comparing the range of the data for each brand? a) a box of raisins from either brand has about 28 raisins. b) the number of raisins in boxes from brand c varies more than boxes from brand d. c) the number of raisins in boxes from brand d varies more than boxes from brand c. d) the number of raisins in boxes from either brand varies about the same.
Answers: 2
Mathematics, 21.06.2019 21:30, swordnewsnetwork
Which of the following disjunctions is true? 4 + 4 = 16 or 6 - 5 = 11 4 · 3 = 7 or 3 - 2 = 5 8 - 5 = 13 or 7 · 2 = 12 7 - 4 = 11 or 6 + 3 = 9
Answers: 1
Do you know the correct answer?
Questions in other subjects:
Mathematics, 23.08.2019 12:30


Chemistry, 23.08.2019 12:30

Mathematics, 23.08.2019 12:30
Biology, 23.08.2019 12:30
Biology, 23.08.2019 12:30

Chemistry, 23.08.2019 12:30


