

Mathematics, 15.07.2020 03:01, falmujaahid026
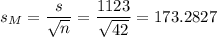
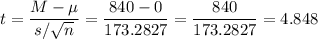
A survey collected data on annual credit card charges in seven different categories of expenditures: transportation, groceries, dining out, household expenses, home furnishings, apparel, and entertainment. Using data from a sample of 42 credit card accounts, assume that each account was used to identify the annual credit card charges for groceries (population 1) and the annual credit card charges for dining out (population 2). Using the difference data, with population 1 − population 2, the sample mean difference was d = $840, and the sample standard deviation was sd = $1,123.
A. Formulate the null abd alternative hypothesis to test for no difference between the population mean credit card charges for groceries and the population mean credit card charges for dining out.
B. Use a .05 level of significance. Can you can conclude that the population mean differ? What is the p-value?
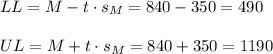
C. Which category, groceries or dining out, has a higher population mean annual credit card charge? What is the point estimate of the difference between the population means? What is the 95% confidence interval estimate of the difference between the population means?

Answers: 2


Other questions on the subject: Mathematics
Mathematics, 21.06.2019 23:00, DisneyGirl11
In an equilateral triangle, each angle is represented by 5y+3. what is the value of y? a. 9.7 b. 10.8 c. 11.4 d. 7.2
Answers: 1
Mathematics, 22.06.2019 03:30, ryleepretty
15. jiovanni is looking in to two different companies that offer study guides for math exams. test prep 101 charges a $5 flat fee and an additional $0.25 per problem. math charges a $2 flat fee and an additional $0.50 per problem. how many prablems would make the costs of the two companies be equal? varibles: equations/eniqualities{ {
Answers: 1
Mathematics, 22.06.2019 03:50, aleanroverto723
Which additional information, if true, would to prove that δlmp ≅ δnmp by hl? check all that apply.
Answers: 1
Mathematics, 22.06.2019 05:20, tannerlynn4320
(! ) the figure below shows parallelograms abce, pqrs, and tnlm on a coordinate plane. points s, p, q, and r are midpoints of abce t, n, l, and m are midpoints of pqrs write the equation of line ml. show your work.
Answers: 1
Do you know the correct answer?
A survey collected data on annual credit card charges in seven different categories of expenditures:...
Questions in other subjects:

Biology, 08.12.2019 08:31
Mathematics, 08.12.2019 08:31

English, 08.12.2019 08:31

History, 08.12.2019 08:31

Social Studies, 08.12.2019 08:31
Social Studies, 08.12.2019 08:31


