

Mathematics, 15.07.2020 03:01, lancaster4977p8mk46
The accompanying data represent the total travel tax (in dollars) for a 3-day business trip in 8 randomly selected cities. A normal probability plot suggests the data could come from a population that is normally distributed. A boxplot indicates there are no outliers.
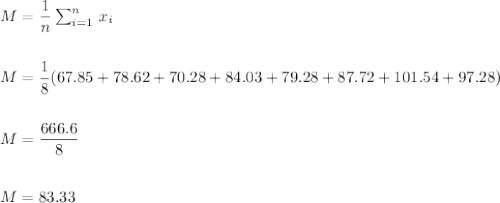
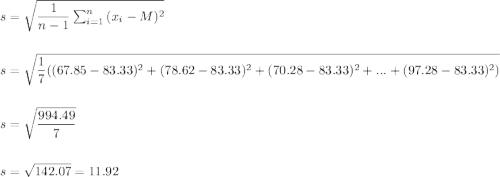
67.85 78.62 70.28 84.03 79.28 87.72 101.54 97.28
1. Determine a point estimate for the population mean travel tax.
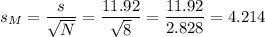
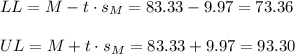
2. Construct and interpret a 95% confidence interval for the mean tax paid for a three-day business trip.
Filling the missing boxes.
The lower bound is $and the upper bound is $. One can be% confident that all cities have a travel tax between these values.
The lower bound is $and the upper bound is $. The travel tax is between these values for% of all cities.
The lower bound is $and the upper bound is $. There is a% probability that the mean travel tax for all cities is between these values.
The lower bound is $and the upper bound is. One can be% confident that the mean travel tax for all cities is between these values.
3. What would you recommend to a researcher who wants to increase the precision of the interval, but does not have access to additional data?
A. The researcher could decrease the level of confidence.
B. The researcher could decrease the sample standard deviation.
C. The researcher could increase the level of confidence.
D. The researcher could increase the sample mean.

Answers: 2


Other questions on the subject: Mathematics
Mathematics, 21.06.2019 19:00, dfrtgyuhijfghj4794
Since opening night, attendance at play a has increased steadily, while attendance at play b first rose and then fell. equations modeling the daily attendance y at each play are shown below, where x is the number of days since opening night. on what day(s) was the attendance the same at both plays? what was the attendance? play a: y = 8x + 191 play b: y = -x^2 + 26x + 126 a. the attendance was never the same at both plays. b. the attendance was the same on day 5. the attendance was 231 at both plays on that day. c. the attendance was the same on day 13. the attendance was 295 at both plays on that day. d. the attendance was the same on days 5 and 13. the attendance at both plays on those days was 231 and 295 respectively.
Answers: 1
Mathematics, 21.06.2019 20:30, icantspeakengles
In priyas math class there are 10 boys and 15 girls. what is the ratio of boys to girls in priyas math class? express your answer as a decimal
Answers: 1
Mathematics, 21.06.2019 21:10, samiam61
Which question is not a good survey question? a. don't you agree that the financial crisis is essentially over? 63on average, how many hours do you sleep per day? c. what is your opinion of educational funding this year? d. are you happy with the availability of electronic products in your state?
Answers: 2
Mathematics, 21.06.2019 22:20, abbygriffin8575
Which graph has figures that can undergo a similarity transformation to justify that they are similar? (obviously not the third one)
Answers: 2
Do you know the correct answer?
The accompanying data represent the total travel tax (in dollars) for a 3-day business trip in 8 ran...
Questions in other subjects:
Mathematics, 12.07.2019 02:00

Mathematics, 12.07.2019 02:00


