

Mathematics, 14.07.2020 01:01, eliza35
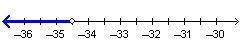
Which inequality is represented by this graph? A number line going from negative 36 to negative 30. An open circle is at negative 34.5. Everything to the left of the circle is shaded. Negative 34.5 greater-than x Negative 34.5 less-than x Negative 35.5 greater-than x Negative 35.5 less-than x

Answers: 2


Other questions on the subject: Mathematics
Mathematics, 21.06.2019 15:10, teamzomaxx6584
What is the equation of the graph below? y=sec(x)-4
Answers: 3
Mathematics, 21.06.2019 20:00, ismailear18
Anyone? 15m is what percent of 60m; 3m; 30m; 1.5 km?
Answers: 1
Do you know the correct answer?
Which inequality is represented by this graph? A number line going from negative 36 to negative 30....
Questions in other subjects:


Biology, 23.07.2019 02:00

Spanish, 23.07.2019 02:00
Mathematics, 23.07.2019 02:00
Biology, 23.07.2019 02:00

History, 23.07.2019 02:00


