

Mathematics, 15.07.2020 01:01, wmaingrette1
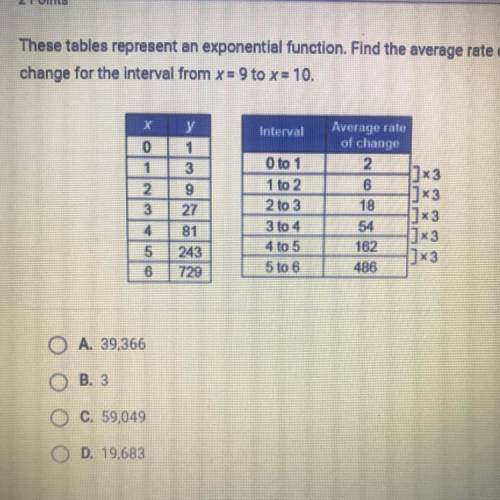
These tables represent an exponential function. Find the average rate of
change for the interval from x = 9 to x = 10.
Interval
0
1
y
1
3
9
27
2
Average rate
of change
2
1]x3
6
4] x3
18
|] 3
54
1]×3
162
1]x3
486
O to 1
1 to 2
2 to 3
3 to 4
4 to 5
5 to 6
3
4
5
6
81
243
729

Answers: 3


Other questions on the subject: Mathematics
Mathematics, 21.06.2019 14:30, thnguyen0720
Find all the values of x that make 0.1x + 0.25(102 - x) < 17.10 true.
Answers: 1
Mathematics, 21.06.2019 15:30, xxxamslashxxx9
Data was collected on myrtle beach for 11 consecutive days. each day the temperature and number of visitors was noted. the scatter plot below represents this data. how many people visited the beach when the temperature was 84 degrees?
Answers: 1
Mathematics, 21.06.2019 17:30, pleasehelpme666
Δabc is dilated by a scale factor of 3 with the origin as the center of dilation to form δa′b′c′. the slope of is -1.2. the length of is p units, the length of is q units, and the length of is r units. the slope of is . the length of is units.
Answers: 2
Mathematics, 21.06.2019 19:00, aliviafrancois2000
Atriangle has a side lengths of 18cm, 80 cm and 81cm. classify it as acute obtuse or right?
Answers: 2
Do you know the correct answer?
These tables represent an exponential function. Find the average rate of
change for the interval fr...
Questions in other subjects:


Spanish, 29.06.2019 04:30

Geography, 29.06.2019 04:30


Social Studies, 29.06.2019 04:30


