


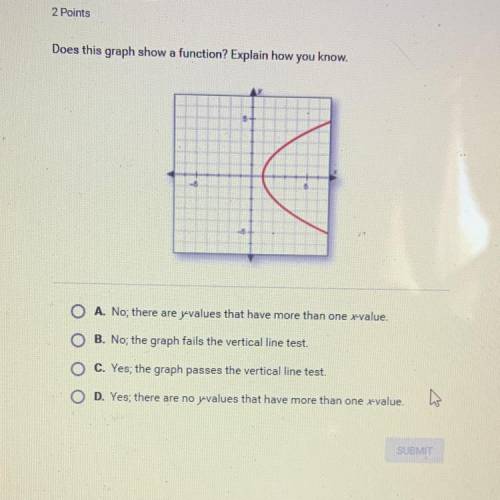
Does this graph show a function? Explain how you know.
A
O A. No, there are y values that hav...

Mathematics, 14.07.2020 22:01, xander252577
Does this graph show a function? Explain how you know.
A
O A. No, there are y values that have more than one x-value.
O B. No, the graph fails the vertical line test.
OC. Yes, the graph passes the vertical line test.
O D. Yes; there are no pevalues that have more than one x-value. Do
SUBMIT

Answers: 3
Other questions on the subject: Mathematics
Mathematics, 22.06.2019 03:30, chrissycherry
Find the cocordinatse of the point on y axis which is nearest to the point (-2,5)
Answers: 2
Mathematics, 22.06.2019 04:20, blueval3tine
The width of a piece of rectangular land is 5m shorter rhan 1/3 of its length .find the width of the land if the length is 60m,150m.
Answers: 2
Do you know the correct answer?
Questions in other subjects:

Biology, 11.10.2019 21:40

Mathematics, 11.10.2019 21:40


English, 11.10.2019 21:40


