


The graph shows a distribution of data with a standard
deviation of 6.
Which statement is tru...

Mathematics, 13.07.2020 19:01, kayliebug2003
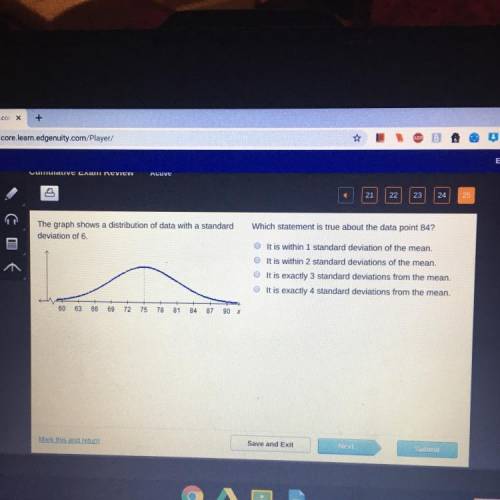
The graph shows a distribution of data with a standard
deviation of 6.
Which statement is true about the data point 84?
It is within 1 standard deviation of the mean.
It is within 2 standard deviations of the mean.
It is exactly 3 standard deviations from the mean.
It is exactly 4 standard deviations from the mean.
60 63 66 69 72 75 78 81 84 87 90 x

Answers: 2
Other questions on the subject: Mathematics
Mathematics, 21.06.2019 14:30, stacy021603
In trapezoid efgh, m∠hef=(4x2+16)∘ and m∠gfe=(5x2+12)∘. find the value of x so that efgh is isosceles.
Answers: 1
Mathematics, 21.06.2019 20:00, naimareiad
Ialready asked this but i never got an answer. will give a high rating and perhaps brainliest. choose the linear inequality that describes the graph. the gray area represents the shaded region. y ≤ –4x – 2 y > –4x – 2 y ≥ –4x – 2 y < 4x – 2
Answers: 1
Do you know the correct answer?
Questions in other subjects:
Mathematics, 01.02.2021 23:20

Mathematics, 01.02.2021 23:20
Mathematics, 01.02.2021 23:20
Mathematics, 01.02.2021 23:20

Social Studies, 01.02.2021 23:20

History, 01.02.2021 23:20
Social Studies, 01.02.2021 23:20


