

Mathematics, 14.07.2020 19:01, maxraph108
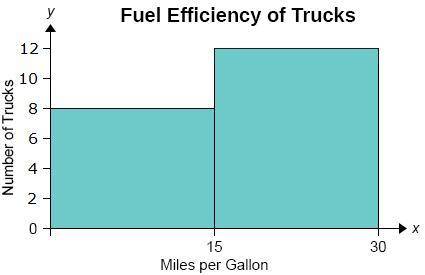
A manufacturer collected the following data on the fuel efficiency of its trucks in miles per gallon. (20, 22, 21, 25, 15, 16, 18, 21, 9, 12, 14, 17, 11, 14, 26, 27, 11, 12, 20, 14) The manufacturer also created a histogram to summarize the data. Explain what’s wrong with the current intervals for the histogram’s bins.

Answers: 3


Other questions on the subject: Mathematics
Mathematics, 21.06.2019 15:30, cbaillie8462
20 only answer if 100% sure most high school-aged teens are very active. a. true b. false
Answers: 2
Mathematics, 21.06.2019 22:00, amandajennings01
22. catie is starting a babysitting business. she spent $26 to make signs to advertise. she charges an initial fee of $5 and then $3 for each hour of service. write and solve an inequality to find the number of hours she will have to babysit to make a profit. interpret the solution.!
Answers: 1
Mathematics, 21.06.2019 22:00, Mgarcia325
Apackage of five erasers cost 0. $.39 at this rate how many how much would 60 erasers cost in dollars and cents
Answers: 2
Do you know the correct answer?
A manufacturer collected the following data on the fuel efficiency of its trucks in miles per gallon...
Questions in other subjects:

Mathematics, 31.03.2021 14:00
Mathematics, 31.03.2021 14:00


Mathematics, 31.03.2021 14:00
English, 31.03.2021 14:00


