

Mathematics, 14.07.2020 19:01, heebi4jeebi
)
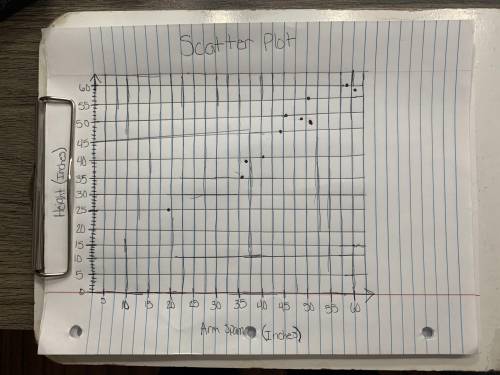
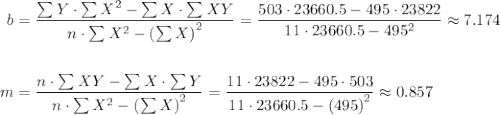
1. Write the equation of the line of best fit using the slope-intercept formula y = mx + b. Show all your work, including the points used to determine the slope and how the equation was determined.
2. What does the slope of the line represent within the context of your graph? What does the y-intercept represent?
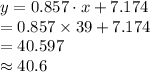
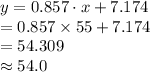
3. Test the residuals of two other points to determine how well the line of best fit models the data.
4. Use the line of best fit to help you to describe the data correlation.

Answers: 2


Other questions on the subject: Mathematics
Mathematics, 21.06.2019 17:00, aberiele1998
The table shows population statistics for the ages of best actor and best supporting actor winners at an awards ceremony. the distributions of the ages are approximately bell-shaped. compare the z-scores for the actors in the following situation. best actor best supporting actor muequals42.0 muequals49.0 sigmaequals7.3 sigmaequals15 in a particular year, the best actor was 59 years old and the best supporting actor was 45 years old. determine the z-scores for each. best actor: z equals best supporting actor: z equals (round to two decimal places as needed.) interpret the z-scores. the best actor was (more than 2 standard deviations above more than 1 standard deviation above less than 1 standard deviation above less than 2 standard deviations below) the mean, which (is not, is) unusual. the best supporting actor was (less than 1 standard deviation below more than 1 standard deviation above more than 2 standard deviations below more than 1 standard deviation below) the mean, which (is is not) unusual.
Answers: 1
Mathematics, 22.06.2019 00:00, lllamasarebae5995
I've been working on this for a few days and i just don't understand, it's due in a few hours. you. the direction of a vector is defined as the angle of the vector in relation to a horizontal line. as a standard, this angle is measured counterclockwise from the positive x-axis. the direction or angle of v in the diagram is α.part a: how can you use trigonometric ratios to calculate the direction α of a general vector v = < x, y> similar to the diagram? part bsuppose that vector v lies in quadrant ii, quadrant iii, or quadrant iv. how can you use trigonometric ratios to calculate the direction (i. e., angle) of the vector in each of these quadrants with respect to the positive x-axis? the angle between the vector and the positive x-axis will be greater than 90 degrees in each case. part cnow try a numerical problem. what is the direction of the vector w = < -1, 6 > ?
Answers: 1
Do you know the correct answer?
)
1. Write the equation of the line of best fit using the slope-intercept formula y = mx + b. Show...
Questions in other subjects:

English, 25.09.2019 07:30

World Languages, 25.09.2019 07:30


History, 25.09.2019 07:30

Mathematics, 25.09.2019 07:30


