

Mathematics, 14.07.2020 17:01, hernandezbrandon059
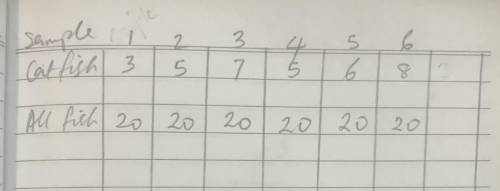
A 7-column table with 2 rows. Column 1 is labeled Sample with entries catfish, all fish. Column 2 is labeled 1 with entries 3, 20. Column 3 is labeled 2 with entries 5, 20. Column 4 is labeled 3 with entries 7, 20. Column 5 is labeled 4 with entries 5, 20. Column 6 is labeled 5 with entries 6, 20. Column 7 is labeled 6 with entries 8, 20. The mean number of catfish in all 6 samples is approximately 5.7. If 200 fish are in the pond, which proportion can be used to predict the number of catfish in the population? StartFraction 5.7 over 20 EndFraction = StartFraction x over 200 EndFraction StartFraction 5.7 over 20 EndFraction = StartFraction 200 over x EndFraction StartFraction 34 over 20 EndFraction = StartFraction x over 200 EndFraction StartFraction 8 over 20 EndFraction = StartFraction 20 over x EndFraction

Answers: 3


Other questions on the subject: Mathematics
Mathematics, 22.06.2019 00:00, cchave9563
Asequence is a function whose is the set of natural numbers
Answers: 1
Mathematics, 22.06.2019 02:00, mathhelppls14
1. the manager of collins import autos believes the number of cars sold in a day (q) depends on two factors: (1) the number of hours the dealership is open (h) and (2) the number of salespersons working that day (s). after collecting data for two months (53 days), the manager estimates the following log-linear model: q 4 equation 1 a. explain, how to transform the log-linear model into linear form that can be estimated using multiple regression analysis. the computer output for the multiple regression analysis is shown below: q4 table b. how do you interpret coefficients b and c? if the dealership increases the number of salespersons by 20%, what will be the percentage increase in daily sales? c. test the overall model for statistical significance at the 5% significance level. d. what percent of the total variation in daily auto sales is explained by this equation? what could you suggest to increase this percentage? e. test the intercept for statistical significance at the 5% level of significance. if h and s both equal 0, are sales expected to be 0? explain why or why not? f. test the estimated coefficient b for statistical significance. if the dealership decreases its hours of operation by 10%, what is the expected impact on daily sales?
Answers: 2
Do you know the correct answer?
A 7-column table with 2 rows. Column 1 is labeled Sample with entries catfish, all fish. Column 2 is...
Questions in other subjects:

Biology, 03.07.2019 22:00
Mathematics, 03.07.2019 22:00

History, 03.07.2019 22:00

Mathematics, 03.07.2019 22:00

English, 03.07.2019 22:00
History, 03.07.2019 22:00

Business, 03.07.2019 22:00


