

Mathematics, 14.07.2020 19:01, kaylallangari1509
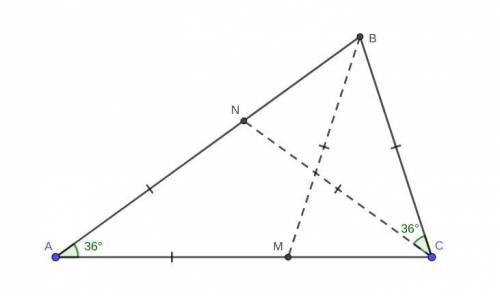
In triangle ABC, points N and M lie on sides AB and AC, respectively. Given AM = AN = BM = NC = BC, find m∠BAC.

Answers: 2


Other questions on the subject: Mathematics
Mathematics, 21.06.2019 13:00, gerardoblk5931
1.) 2x + y = 3 2.) x - 2y = -1 if equation 1 is multiplied by 2 and then the equations are added, the result is a.3x = 2 b.3x = 5 c.5x = 5
Answers: 1
Mathematics, 21.06.2019 15:00, Broov
Asap the total attendance for all of a baseball league in 2012 was about 7.5×10⁷ fans, while the attendance for the tornadoes in 2012 was about 1.5×10⁶ fans. about how many times more was the attendance for the entire baseball league than the attendance for just the tornadoes? 50 times more 10 times more 2 times more 5 times more
Answers: 2
Mathematics, 21.06.2019 16:00, kell22wolf
Part one: measurements 1. measure your own height and arm span (from finger-tip to finger-tip) in inches. you will likely need some from a parent, guardian, or sibling to get accurate measurements. record your measurements on the "data record" document. use the "data record" to you complete part two of this project. name relationship to student x height in inches y arm span in inches archie dad 72 72 ginelle mom 65 66 sarah sister 64 65 meleah sister 66 3/4 67 rachel sister 53 1/2 53 emily auntie 66 1/2 66 hannah myself 66 1/2 69 part two: representation of data with plots 1. using graphing software of your choice, create a scatter plot of your data. predict the line of best fit, and sketch it on your graph. part three: the line of best fit include your scatter plot and the answers to the following questions in your word processing document 1. 1. which variable did you plot on the x-axis, and which variable did you plot on the y-axis? explain why you assigned the variables in that way. 2. write the equation of the line of best fit using the slope-intercept formula $y = mx + b$. show all your work, including the points used to determine the slope and how the equation was determined. 3. what does the slope of the line represent within the context of your graph? what does the y-intercept represent? 5. use the line of best fit to you to describe the data correlation.
Answers: 2
Mathematics, 21.06.2019 18:40, banditballer2
Complete the steps, which describe how to find the area of the shaded portion of the circle. find the area of the sector by multiplying the area of the circle by the ratio of the to 360. subtract the area of the triangle from the area of the sector.
Answers: 3
Do you know the correct answer?
In triangle ABC, points N and M lie on sides AB and AC, respectively. Given AM = AN = BM = NC = BC,...
Questions in other subjects:


Social Studies, 11.07.2019 14:30
Social Studies, 11.07.2019 14:30

Geography, 11.07.2019 14:30


Chemistry, 11.07.2019 14:30


