

Mathematics, 08.07.2020 02:01, rwerjekrryery6750
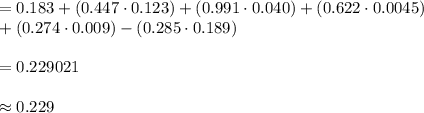
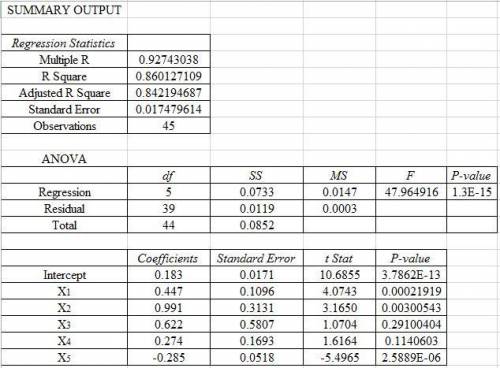
You decided to join a fantasy Baseball league and you think the best way to pick your players is to look at their Batting Averages. You want to use data from the previous season to help predict Batting Averages to know which players to pick for the upcoming season. You want to use Runs Score, Doubles, Triples, Home Runs and Strike Outs to determine if there is a significant linear relationship for Batting Averages. You collect data to, to help estimate Batting Average, to see which players you should choose. You collect data on 45 players to help make your decision. x1 = Runs Score/Times at Batx2 = Doubles/Times at Batx3 = Triples/Times at Batx4 = Home Runs/Times at Batx5= Strike Outs/Times at BatEstimate the Batting Average when Run Score = 0.123, Doubles = 0.040, Triples = 0.0045 , Home Runs = 0.009 and Strike Outs = 0.189DATA:Batting Average RS/Times at Bat Doubles/Times at Bat Triples/times at bat HR/Times at Bat SO/Times at Bat0.283 0.144 0.049 0.012 0.013 0.0860.276 0.125 0.039 0.013 0.002 0.0620.281 0.141 0.045 0.021 0.013 0.0740.328 0.189 0.043 0.001 0.03 0.0320.29 0.161 0.044 0.011 0.07 0.0760.296 0.186 0.047 0.018 0.05 0.0070.248 0.106 0.036 0.008 0.012 0.0950.228 0.117 0.03 0.006 0.003 0.1450.305 0.174 0.05 0.008 0.061 0.1120.254 0.094 0.041 0.005 0.014 0.1240.269 0.147 0.047 0.012 0.009 0.1110.3 0.141 0.058 0.01 0.011 0.070.307 0.135 0.041 0.009 0.005 0.0650.214 0.1 0.037 0.003 0.004 0.1380.329 0.189 0.058 0.014 0.011 0.0320.31 0.149 0.05 0.012 0.05 0.060.252 0.119 0.04 0.008 0.049 0.2330.308 0.158 0.038 0.013 0.003 0.0680.342 0.259 0.06 0.016 0.085 0.1580.358 0.193 0.066 0.021 0.037 0.0830.34 0.155 0.051 0.02 0.012 0.040.304 0.197 0.052 0.008 0.054 0.0950.248 0.133 0.037 0.003 0.043 0.1350.367 0.196 0.063 0.026 0.01 0.0310.325 0.206 0.054 0.027 0.01 0.0480.244 0.11 0.025 0.006 0 0.0610.245 0.096 0.044 0.003 0.022 0.1510.318 0.193 0.063 0.02 0.037 0.0810.207 0.154 0.045 0.008 0 0.2520.32 0.204 0.053 0.017 0.013 0.070.243 0.141 0.041 0.007 0.051 0.2640.317 0.209 0.057 0.03 0.017 0.0580.199 0.1 0.029 0.007 0.011 0.1880.294 0.158 0.034 0.019 0.005 0.0140.221 0.087 0.038 0.006 0.015 0.1420.301 0.163 0.068 0.016 0.022 0.0920.298 0.207 0.042 0.009 0.066 0.2110.304 0.197 0.052 0.008 0.054 0.0950.297 0.16 0.049 0.007 0.038 0.1010.188 0.064 0.044 0.007 0.002 0.2050.214 0.1 0.037 0.003 0.004 0.1380.218 0.082 0.061 0.002 0.012 0.1470.284 0.131 0.049 0.012 0.021 0.130.27 0.17 0.026 0.011 0.002 00.277 0.15 0.053 0.005 0.039 0.115Possible Answers:A. 0.223B. 0.057C. 0.043D. 0.229

Answers: 3


Other questions on the subject: Mathematics
Mathematics, 21.06.2019 14:00, kah36
When drawing a trend line for a series of data on a scatter plot, which of the following is true? a. there should be an equal number of data points on either side of the trend line. b. all the data points should lie on one side of the trend line. c. the trend line should not intersect any data point on the plot. d. the trend line must connect each data point on the plot.
Answers: 2
Mathematics, 21.06.2019 16:40, naomicervero
Which of the following is the correct equation for this function? a. y= (x+4)(x+2) b. y=x^2+ 3x – 2 c. y+ 2 = – 2(x+3)^2 d. y+ 2 = 2(x+3)^2
Answers: 1
Mathematics, 21.06.2019 18:10, chyyy3
The means and mean absolute deviations of the individual times of members on two 4x400-meter relay track teams are shown in the table below. means and mean absolute deviations of individual times of members of 4x400-meter relay track teams team a team b mean 59.32 s 59.1 s mean absolute deviation 1.5 s 245 what percent of team b's mean absolute deviation is the difference in the means? 9% 15% 25% 65%
Answers: 2
Mathematics, 21.06.2019 18:30, avahrhey24
Sketch one cycle if the cosine function y=2cos2theta
Answers: 1
Do you know the correct answer?
You decided to join a fantasy Baseball league and you think the best way to pick your players is to...
Questions in other subjects:

Mathematics, 08.04.2020 04:32

Mathematics, 08.04.2020 04:32


