

Mathematics, 07.07.2020 23:01, Fireburntbudder
100 POINTS
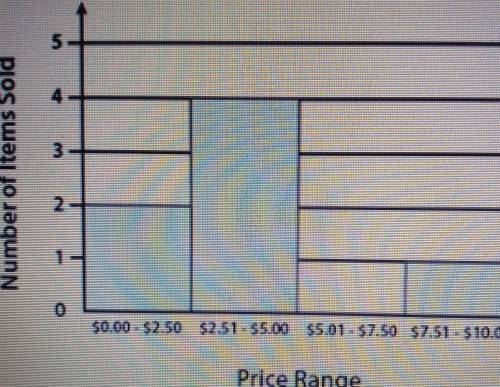
the following histogram shows the number of items sold at a grocery store at various prices:
which of the following data sets is represented in the histogram
{O.50, 2.00, 2.52, 3.37, 4.53, 5.00, 8.99}
{2, 4, 0, 1}
{2.50, 2.51, 5.00, 5.01, 7.50, 9.00, 10.00}
{0.50, 2.51, 5.00, 5.00, 7.51}

Answers: 1


Other questions on the subject: Mathematics
Mathematics, 21.06.2019 23:10, CrownedQueen
Click an item in the list or group of pictures at the bottom of the problem and, holding the button down, drag it into the correct position in the answer box. release your mouse button when the item is place. if you change your mind, drag the item to the trashcan. click the trashcan to clear all your answers. find the lateral area for the prism. l. a. = 0123456789
Answers: 3
Do you know the correct answer?
100 POINTS
the following histogram shows the number of items sold at a grocery store at various pri...
Questions in other subjects:

Mathematics, 26.09.2019 01:00

Biology, 26.09.2019 01:00

History, 26.09.2019 01:00
English, 26.09.2019 01:00

History, 26.09.2019 01:00
Mathematics, 26.09.2019 01:00


