

Mathematics, 03.07.2020 19:01, flippinhailey
100 POINTS
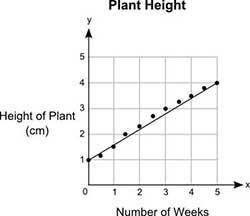
The graph shows the heights, y (in centimeters), of a plant after a certain number of weeks, x. Donna drew the line of best fit on the graph. What would most likely be the approximate height of the plant after 8 weeks?
11.0 centimeters
9.25 centimeters
8.8 centimeters
7.4 centimeters

Answers: 1


Other questions on the subject: Mathematics
Mathematics, 21.06.2019 18:30, zoeatlowapple
An optical inspection system is used to distinguish among different part types. the probability of a correct classification of any part is 0.92. suppose that three parts are inspected and that the classifications are independent. let the random variable x denote the number of parts that are correctly classified. determine the probability mass function of x. round your answers to four decimal places (e. g. 98.7654). x f(x) 0 1 2 3
Answers: 2
Mathematics, 21.06.2019 22:00, connorhanratty6487
James is playing his favorite game at the arcade. after playing the game 33 times, he has 88 tokens remaining. he initially had 2020 tokens, and the game costs the same number of tokens each time. the number tt of tokens james has is a function of gg, the number of games he plays
Answers: 1
Mathematics, 22.06.2019 03:30, tystar84
The elmina wilson company produces spaghetti sauce that is used in restaurants. the fixed costs total $1,329,050. the selling price per 64 oz. can of sauce is $12.40. the variable cost per can is $4.80. what is the break-even point in number of cans?
Answers: 1
Do you know the correct answer?
100 POINTS
The graph shows the heights, y (in centimeters), of a plant after a certain number of we...
Questions in other subjects:


Computers and Technology, 25.06.2019 05:40

History, 25.06.2019 05:50


