

Mathematics, 04.07.2020 14:01, crazymadhatter0
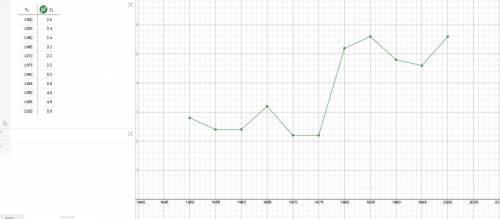
8. The table shows the rate per 1000 population of divorces from 1950 to 2000 at five-year intervals. Plot (Year, Divorces) in a
Cartesian coordinate system, and connect the points with line segments.
Year 1950 1955 1960 1965 1970 1975 1980|1985 1990 1995 2000
Divorces 2.8 | 2.4 | 2.4 | 3.2 2.2 2.2 5.2 5.6 4.8 4.6 5.6
Choose the correct graph below.

Answers: 2


Other questions on the subject: Mathematics
Mathematics, 20.06.2019 18:02, milkshakegrande101
Three children each had the same amount of money in their savings account. one of the children withdrew three quarters of her moneyand spent it all on a $100 sports jersey. what was the total amount of money originally in the accounts?
Answers: 1
Mathematics, 21.06.2019 20:30, destinyharris8502
I’m on question 7 it says a covered water tank is in the shape of a cylinder the tank has a 28 inch diameter and a height of 66 inches to the nearest square inch what is the surface area of the water tank
Answers: 2
Mathematics, 21.06.2019 21:20, caseypearson377
Sam is a waiter at a local restaurant where he earns wages of $5 per hour sam figures that he also eams about $3 in tips for each person he serves sam works 6 hours on a particular day. if n represents the number of people sam serves that day, which of the following functions could sam use to figure ehis total earings for the do o a. en) = 30 o b. en) = 5n+ 18
Answers: 2
Do you know the correct answer?
8. The table shows the rate per 1000 population of divorces from 1950 to 2000 at five-year intervals...
Questions in other subjects:
Mathematics, 07.12.2021 21:10

History, 07.12.2021 21:10
Mathematics, 07.12.2021 21:10

Biology, 07.12.2021 21:10

English, 07.12.2021 21:10
History, 07.12.2021 21:10
Mathematics, 07.12.2021 21:10
Mathematics, 07.12.2021 21:10


