

Mathematics, 04.07.2020 04:01, drax13
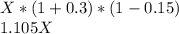
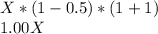
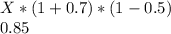
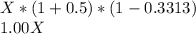
Drag each scenario to show whether the final result will be greater than the original value, less than the original value, or the same as the original value. Clear Check A 30% 30% increase followed by a 15% 15% decrease A $35 $35 decrease followed by a $25 $25 increase A 50% 50% decrease followed by a 100% 100% increase A 70% 70% increase followed by a 50% 50% decrease A 50% 50% increase followed by a 33 1 3 % 3313% decrease Same as the original Less than the original Greater than the original

Answers: 2


Other questions on the subject: Mathematics
Mathematics, 21.06.2019 21:10, madisontrosclair2
Plot a point at the y-intercept of the following function on the provided graph. 3y=-5x+7 20 points
Answers: 1
Mathematics, 21.06.2019 23:00, gisellekatherine1
The equation represents the function f, and the graph represents the function g. f(x)=3(5/2)^x determine the relationship between the growth factors of f and g. a. the growth factor of g is twice the growth factor of f. b. the growth factor of f is twice the growth factor of g. c. the growth factor of f is 2.5 times the growth factor of g. d. the growth factor of f is the same as the growth factor of g.
Answers: 3
Mathematics, 22.06.2019 00:40, emmanuellugo40
Compute the standard deviation of the following set of data to the nearest whole number. 10, 10, 15, 20, 25
Answers: 3
Do you know the correct answer?
Drag each scenario to show whether the final result will be greater than the original value, less th...
Questions in other subjects:

Chemistry, 06.12.2021 18:40

Mathematics, 06.12.2021 18:40
Mathematics, 06.12.2021 18:40
Mathematics, 06.12.2021 18:40
Mathematics, 06.12.2021 18:40

History, 06.12.2021 18:40
Mathematics, 06.12.2021 18:50


