

Mathematics, 03.07.2020 23:01, ytyugguuh56
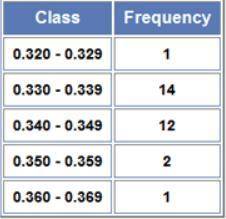
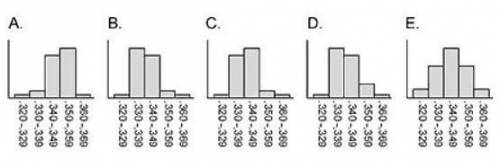
A frequency table for the 30 best lifetime baseball batting averages of all time is shown to the right. These data can be graphically displayed as a histogram. Which of the following graphs correctly displays the data from the table? A. Graph A B. Graph B C. Graph C D. Graph D E. Graph E

Answers: 3


Other questions on the subject: Mathematics
Mathematics, 21.06.2019 16:00, ashleyremon901
What is the value of x? enter your answer in the box. x = two intersecting tangents that form an angle of x degrees and an angle of 134 degrees.
Answers: 3
Mathematics, 21.06.2019 18:00, SunsetPrincess
Solve this equation using substitution. {4x + y = −2} {4x + 6y = 44}
Answers: 1
Mathematics, 21.06.2019 20:30, GreenHerbz206
Tom is the deli manager at a grocery store. he needs to schedule employee to staff the deli department for no more that 260 person-hours per week. tom has one part-time employee who works 20 person-hours per week. each full-time employee works 40 person-hours per week. write and inequality to determine n, the number of full-time employees tom may schedule, so that his employees work on more than 260 person-hours per week. graph the solution set to this inequality.
Answers: 1
Do you know the correct answer?
A frequency table for the 30 best lifetime baseball batting averages of all time is shown to the rig...
Questions in other subjects:


Business, 13.01.2020 08:31
Mathematics, 13.01.2020 08:31
Business, 13.01.2020 08:31


English, 13.01.2020 08:31


