

Mathematics, 03.07.2020 04:01, chloebaby8
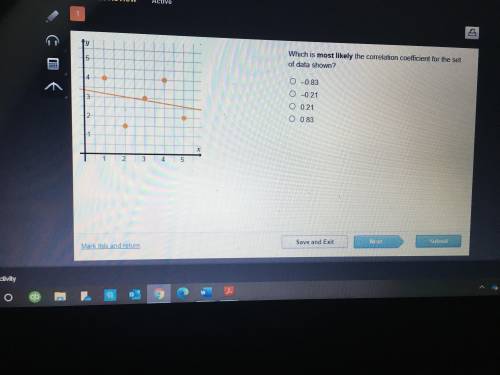
What is most likely the correlation coefficient for the set of data shown? -0.83 -0.21 0.21 0.83

Answers: 1


Other questions on the subject: Mathematics
Mathematics, 21.06.2019 18:20, julieariscar769
Inez has a phone card. the graph shows the number of minutes that remain on her phone card a certain number of days.
Answers: 2
Mathematics, 22.06.2019 00:20, yoyo80431
Sherrie is baking a pie for her family. she leaves the room and comes back to 35% of the pie having been eaten before she can put the topping on. how much 1 square inch strips of dough will she need for the top, now that a portion is missing? round your answer to the nearest while nimber.
Answers: 1
Mathematics, 22.06.2019 01:30, SGARCIA25
Have you ever been in the middle of telling a story and had to use hand gestures or even a drawing to make your point? in algebra, if we want to illustrate or visualize a key feature of a function, sometimes we have to write the function in a different form—such as a table, graph, or equation—to determine the specific key feature we’re looking for. think about interactions with others and situations you’ve come across in your own life. how have you had to adjust or change the way you represented something based on either the concept you were trying to describe or the person you were interacting with? explain how the complexity or layout of the concept required you to change your style or presentation, or how the person’s unique learning style affected the way you presented the information.
Answers: 1
Do you know the correct answer?
What is most likely the correlation coefficient for the set of data shown? -0.83 -0.21 0.21 0.83
Questions in other subjects:
Mathematics, 21.05.2021 23:30


Social Studies, 21.05.2021 23:30


