


1. which line models the data points better and why?
blue, because it's longer
blue, be...

Mathematics, 24.08.2019 00:00, donbright100
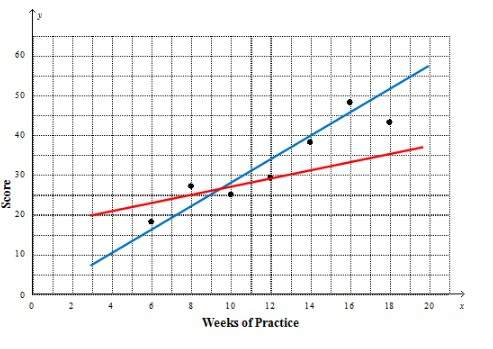
1. which line models the data points better and why?
blue, because it's longer
blue, because the data points are all close to the line
red, because it goes through one of the points
red, because there are three points above the line and three points below the line
2. according to the blue line, what would you estimate the score was after 3 weeks of practice?
about 40
about 18
about 8
about 22
3.according to the blue line, about how many weeks of practice are required to achieve a score of 50?
15 weeks
17 weeks
19 weeks
21 weeks

Answers: 2
Similar questions
Mathematics, 07.07.2019 13:10, user11883661
Answers: 1
Mathematics, 30.07.2019 17:30, delphinelilly2846
Answers: 1
Mathematics, 06.10.2019 22:30, munao4938
Answers: 2
Mathematics, 12.10.2019 05:00, MayFlowers
Answers: 2
Do you know the correct answer?
Questions in other subjects:
Mathematics, 06.12.2021 01:00
Mathematics, 06.12.2021 01:00
Mathematics, 06.12.2021 01:00

History, 06.12.2021 01:00


Chemistry, 06.12.2021 01:00
Mathematics, 06.12.2021 01:00


