


6

Mathematics, 02.07.2020 21:01, erikasee3535
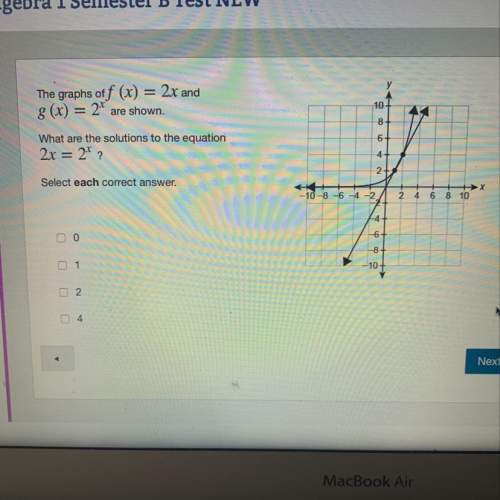
The histogram shows the hours per week that each person in a class watches television.
10
6
Frequency
4
2
0
1-3
7-9
4-6
Interval
10-12
a. How many students are in the class
students
a. What is the relative frequency of students who watch I to 3 hours of TV?
Preview
b. What is the relative frequency of students who watch or more hours of TV?

Answers: 1
Other questions on the subject: Mathematics
Do you know the correct answer?
The histogram shows the hours per week that each person in a class watches television.
10
6
6
Questions in other subjects:

Social Studies, 27.08.2020 01:01
Mathematics, 27.08.2020 01:01


Mathematics, 27.08.2020 01:01


