

Mathematics, 27.06.2020 23:01, idontcare2003
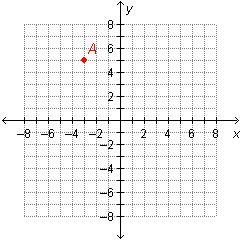
Does this graph show a function? Explain how you know.
O A. No, the graph fails the vertical line test.
O B. Yes, there are no y values that have more than one x-value.
O C. No; there are y values that have more than one x-value.
O D. Yes; the graph passes the vertical line test.
< PREVIOUS

Answers: 3


Other questions on the subject: Mathematics
Mathematics, 21.06.2019 15:00, arias333
Solve the word problem. the table shows the low outside temperatures for monday, tuesday, and wednesday. by how many degrees did the low temperature increase from monday to tuesday? this function table shows the outside temperature for a given a. 21.1⁰ b. 8.6⁰ c. 4.9⁰ d. 3.9⁰(the picture is the graph the the question is talking about.)
Answers: 1
Mathematics, 21.06.2019 19:30, sindy35111
Solve the equation for x.3(6x - 1) = 12 i've tried doing the math and i can't find out what i'm doing wrong
Answers: 1
Mathematics, 22.06.2019 00:30, bercishicicorbin
$5400 is? invested, part of it at 11? % and part of it at 8? %. for a certain? year, the total yield is ? $522.00. how much was invested at each? rate?
Answers: 1
Do you know the correct answer?
Does this graph show a function? Explain how you know.
O A. No, the graph fails the vertical line t...
Questions in other subjects:

Mathematics, 12.01.2021 20:30

English, 12.01.2021 20:30
Mathematics, 12.01.2021 20:30
History, 12.01.2021 20:30


