

Mathematics, 27.06.2020 07:01, PoPFli21
HELP
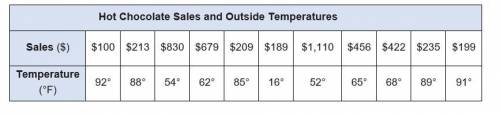
Step 1: Constructing and analyzing scatterplots You keep track of the daily hot chocolate sales and the outside temperature each day. The data you gathered is shown in the data table below. Hot Chocolate Sales and Outside Temperatures Sales ($) $100 $213 $830 $679 $209 $189 $1,110 $456 $422 $235 $199 Temperature (°F) 92° 88° 54° 62° 85° 16° 52° 65° 68° 89° 91° a)
Make a scatterplot of the data above. (2 points) b) Do you notice clusters or outliers in the data?
Explain your reasoning. (2 points) c) How would you describe the correlation in the data?
Explain your reasoning. (2 points)
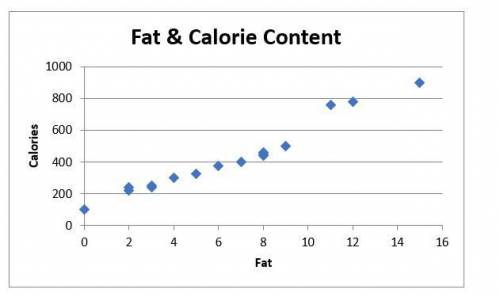
d) What are the independent and dependent variables? (2 points) Step 2: Evaluating trends of data Because you want to prepare and serve the healthiest food possible, you monitor the fat and calorie content of items on your menu. Some of the menu items are included in the graph below.
a) Your business partner describes this as a high positive correlation. Is your partner correct? Why or why not? (2 points)
b) Using the drawing tools, draw a trend line (line of best fit) on the graph above. (2 points)
c) Judge the closeness of your trend line to the data points. Do you notice a relationship between the data points? (2 points)
d) Is the trend line linear? If so, write a linear equation that represents the trend line. Show your work. (3 points)
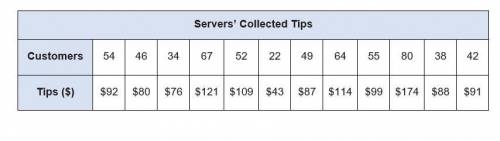
Step 3: Making predictions using data You and your business partner track the number of customers served and the amount of tips collected per day. The data you gathered is displayed in the chart below. Servers’ Collected Tips Customers 54 46 34 67 52 22 49 64 55 80 38 42 Tips ($) $92 $80 $76 $121 $109 $43 $87 $114 $99 $174 $88 $91 a) Create a scatterplot displaying the data in the table. Be sure to include a linear trend line. (2 points)
b) Find the equation of the trend line (line of best fit). Show your work. (2 points)
c) Predict the amount of tips that would be collected if 100 customers were served at the restaurant on a given day. Explain your reasoning. d) Explain how to use the regression calculator to make a reasonable prediction given a data table.

Answers: 1


Other questions on the subject: Mathematics
Mathematics, 21.06.2019 15:50, tmarie03
Which formula finds the probability that a point on the grid below will be in the blue area? p(blue) = total number of squares number of blue squares number of blue squares p(blue) = total number of squares number of blue squares p(blue) = number of white squares
Answers: 1
Mathematics, 22.06.2019 01:40, amendes11
Areflection of shape i across the y-axis, followed by a , and then a translation left 6 units and down 4 units confirms congruence between shape i and shape ii. alternatively, a of shape ii about the origin, followed by a reflection across the y-axis, and then a translation right 4 units and up 6 units confirms congruence between shape ii and shape i.
Answers: 3
Mathematics, 22.06.2019 02:10, genyjoannerubiera
The key on a road map has a scale factor of 1.5 inches = 50 miles. the distance between santa fe and albuquerque measures 7.5 inches. the distance between santa fe and taos is 0.75 inches. what is the actual distance between the cities?
Answers: 3
Do you know the correct answer?
HELP
Step 1: Constructing and analyzing scatterplots You keep track of the daily hot chocolate sale...
Questions in other subjects:


History, 25.10.2019 21:43

Physics, 25.10.2019 21:43
History, 25.10.2019 21:43

English, 25.10.2019 21:43
English, 25.10.2019 21:43
Chemistry, 25.10.2019 21:43


