

Mathematics, 26.06.2020 15:01, ceve18
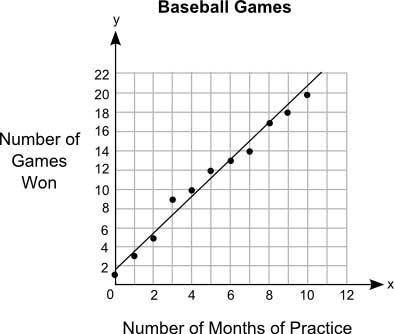
The graph (attached below) shows the relationship between the number of months different students practiced baseball and the number of games they won: Part A: What is the approximate y-intercept of the line of best fit and what does it represent? (5 points) Part B: Write the equation for the line of best fit in slope-intercept form and use it to predict the number of games that could be won after 13 months of practice. (5 points)

Answers: 2


Other questions on the subject: Mathematics
Mathematics, 21.06.2019 23:40, guadalupemarlene2001
Which set of side lengths form a right side? a) 3ft,6ft,5ft b)50 in,48in,14in c)53m,48m,24m d)8cm,17cm,14cm
Answers: 2
Mathematics, 22.06.2019 01:20, blackboy21
1. why is a frequency distribution useful? it allows researchers to see the "shape" of the data. it tells researchers how often the mean occurs in a set of data. it can visually identify the mean. it ignores outliers. 2. the is defined by its mean and standard deviation alone. normal distribution frequency distribution median distribution marginal distribution 3. approximately % of the data in a given sample falls within three standard deviations of the mean if it is normally distributed. 95 68 34 99 4. a data set is said to be if the mean of the data is greater than the median of the data. normally distributed frequency distributed right-skewed left-skewed
Answers: 2
Do you know the correct answer?
The graph (attached below) shows the relationship between the number of months different students pr...
Questions in other subjects:

Computers and Technology, 02.10.2019 14:30

English, 02.10.2019 14:30
Computers and Technology, 02.10.2019 14:30

Physics, 02.10.2019 14:30

Business, 02.10.2019 14:30

English, 02.10.2019 14:30


