


In the graphic below, lines a and b are:
A. skew lines.
B. parallel lines.
C. perpendic...

Mathematics, 24.06.2020 22:01, hulyy2
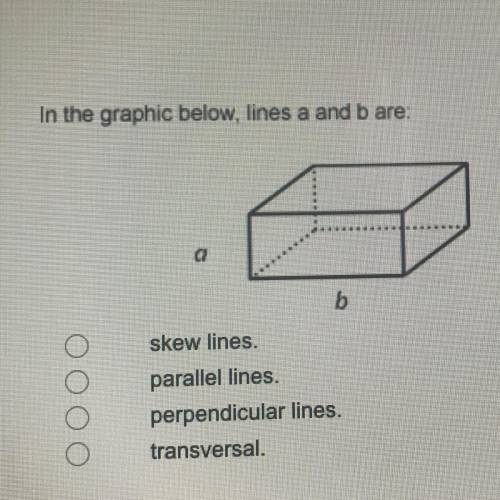
In the graphic below, lines a and b are:
A. skew lines.
B. parallel lines.
C. perpendicular lines.
D. transversal.
(i really need this one)

Answers: 1
Other questions on the subject: Mathematics
Mathematics, 21.06.2019 15:50, Kianna000
Dylan and dusty plan to take weekly surfing lessons together. if the 2-hour lessons are $20 per person and they plan to spend $100 each on new surfboards, what is the maximum number of lessons the two can take if the total amount spent for lessons and surfboards is at most $480?
Answers: 1
Mathematics, 21.06.2019 17:10, ivilkas23
The frequency table shows a set of data collected by a doctor for adult patients who were diagnosed with a strain of influenza. patients with influenza age range number of sick patients 25 to 29 30 to 34 35 to 39 40 to 45 which dot plot could represent the same data as the frequency table? patients with flu
Answers: 2
Mathematics, 21.06.2019 19:50, keigleyhannah30
Use composition to determine if (x) or h(x) is the inverse of f(x) for the limited domain x2-1.
Answers: 3
Mathematics, 21.06.2019 20:20, kenken2583
Complete the input-output table for the linear function y = 3x. complete the input-output table for the linear function y = 3x. a = b = c =
Answers: 2
Do you know the correct answer?
Questions in other subjects:

Biology, 29.07.2019 14:30

Chemistry, 29.07.2019 14:30


History, 29.07.2019 14:30
Chemistry, 29.07.2019 14:30

Mathematics, 29.07.2019 14:30


