


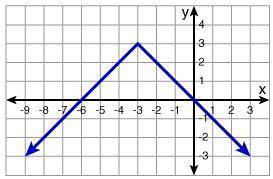
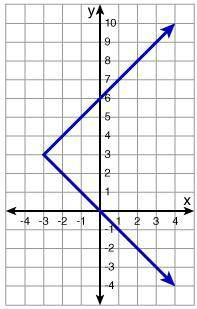
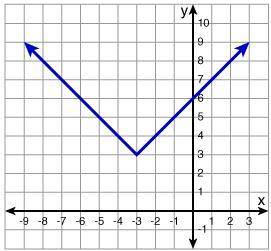
Which graph represents the function below? y -x if x > -3 x +6 if x ≤ -3
...

Mathematics, 24.06.2020 14:01, sweav901
Which graph represents the function below? y -x if x > -3 x +6 if x ≤ -3

Answers: 3
Other questions on the subject: Mathematics
Mathematics, 21.06.2019 18:30, viktoria1198zz
Florence price's brownies and more sells all types of cookies and pastries. on tuesdays, they markdown all brownies 75% to a sale of $1.50 a dozen. find the selling price and the markdown of a dozen brownies.
Answers: 1
Mathematics, 21.06.2019 23:20, braddypeter61
Interpret the following expression (5y^2-7)^3/(2y)^2
Answers: 2
Do you know the correct answer?
Questions in other subjects:


Biology, 08.12.2020 01:00


Social Studies, 08.12.2020 01:00
Mathematics, 08.12.2020 01:00
History, 08.12.2020 01:00


