


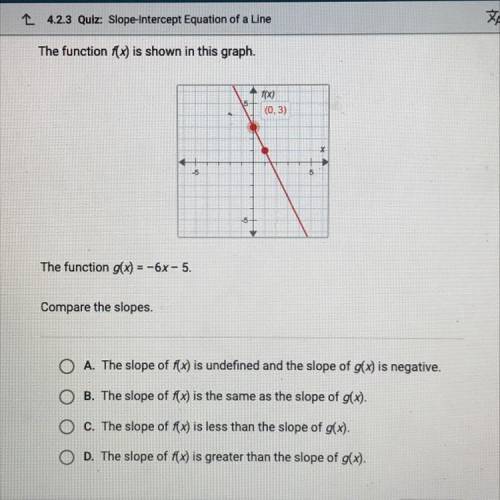
The function f(x) is shown in this graph please help because I can’t understand this concept
...

Mathematics, 23.06.2020 10:57, NewKidnewlessons
The function f(x) is shown in this graph please help because I can’t understand this concept

Answers: 1
Other questions on the subject: Mathematics
Mathematics, 21.06.2019 19:00, michellectucker1982
What is the explicit formula for this sequence? -7, -4, -1, 2, a.) an = 8 + (b - 1)3 b.) an = -7 + (n - 1)3 c.) an = 3 + (n -1) (-7) d.) an = -7 + (n - )
Answers: 1
Do you know the correct answer?
Questions in other subjects:
Mathematics, 01.07.2019 04:00

Arts, 01.07.2019 04:00

English, 01.07.2019 04:00
Mathematics, 01.07.2019 04:00

History, 01.07.2019 04:00
English, 01.07.2019 04:00

Mathematics, 01.07.2019 04:00


