

Mathematics, 22.06.2020 23:55, kimjooin02
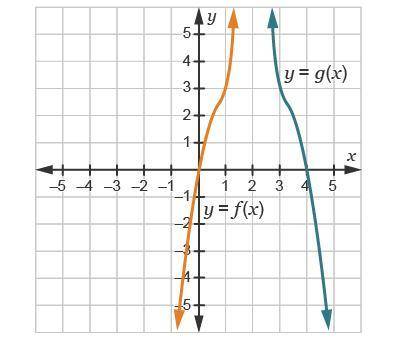
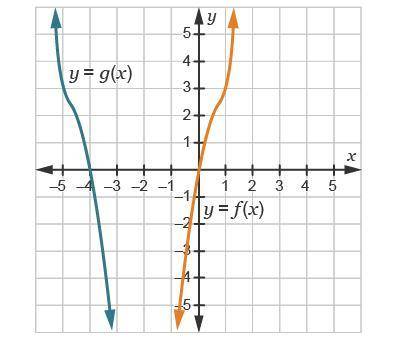
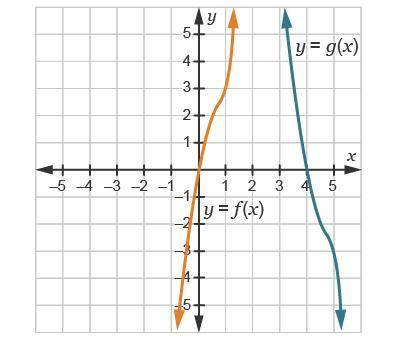
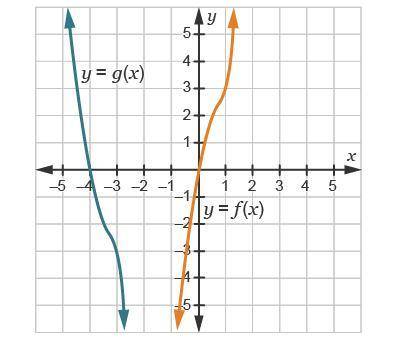
Consider the function f(x) = x5 – 3x2 + 5x. Let g(x) = f(–x + 4). Which shows the graphs of f(x) and g(x)

Answers: 2


Other questions on the subject: Mathematics
Mathematics, 21.06.2019 17:30, nallaico585
What is the greater volume 72 quarts or 23 gallons
Answers: 1
Mathematics, 21.06.2019 19:40, evarod
Afactory makes propeller drive shafts for ships. a quality assurance engineer at the factory needs to estimate the true mean length of the shafts. she randomly selects four drive shafts made at the factory, measures their lengths, and finds their sample mean to be 1000 mm. the lengths are known to follow a normal distribution whose standard deviation is 2 mm. calculate a 95% confidence interval for the true mean length of the shafts. input your answers for the margin of error, lower bound, and upper bound.
Answers: 3
Do you know the correct answer?
Consider the function f(x) = x5 – 3x2 + 5x. Let g(x) = f(–x + 4). Which shows the graphs of f(x) and...
Questions in other subjects:

Mathematics, 17.11.2020 23:00


