


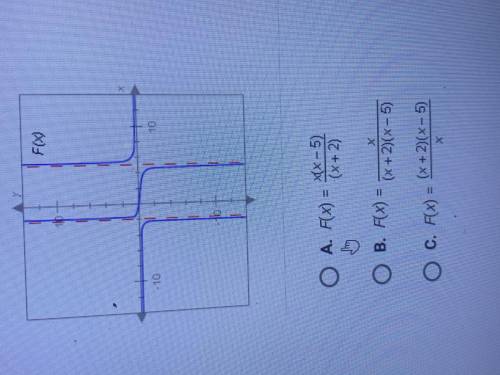
The graph shown here is the graph of which of the following rational functions
...

Mathematics, 18.06.2020 22:57, plb2007
The graph shown here is the graph of which of the following rational functions

Answers: 2
Other questions on the subject: Mathematics
Mathematics, 21.06.2019 19:00, milhai0627a
Acompany manufactures large valves, packed in boxes. a shipment consists of 1500 valves packed in 75 boxes. each box has the outer dimensions 1.2 x 0.8 x 1.6 m and the inner dimensions 1.19 x 0.79 x 1.59 m. the boxes are loaded on a vehicle (truck + trailer). the available capacity in the vehicle combination is 140 m3. each valve has a volume of 0.06 m3. - calculate the load factor on the box level (%). - calculate the load factor on the vehicle level (%). - calculate the overall load factor (%).
Answers: 1
Mathematics, 21.06.2019 19:30, jrassicworld4ever
Need now max recorded the heights of 500 male humans. he found that the heights were normally distributed around a mean of 177 centimeters. which statements about max’s data must be true? a) the median of max’s data is 250 b) more than half of the data points max recorded were 177 centimeters. c) a data point chosen at random is as likely to be above the mean as it is to be below the mean. d) every height within three standard deviations of the mean is equally likely to be chosen if a data point is selected at random.
Answers: 1
Do you know the correct answer?
Questions in other subjects:

Mathematics, 31.10.2021 01:30


History, 31.10.2021 01:30


