

Mathematics, 18.06.2020 23:57, jazzy2742
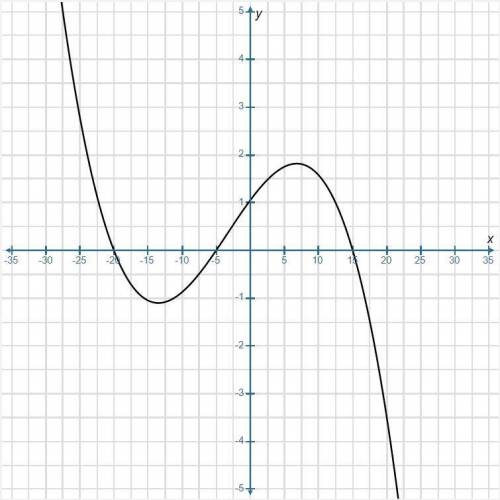
Polynomials are great functions to use for modeling real-world scenarios where different intervals of increase and decrease happen. But polynomial equations and graphs can be trickier to work with than other function types. In mathematical modeling, we often create an equation to summarize data and make predictions for information not shown on the original display. In this activity, you’ll create an equation to fit this graph of a polynomial function. Part A Describe the type of function shown in the graph. Part B What are the standard form and the factored form of the function? Part C What are the zeros of the function? Part D Use the zeros to find all of the linear factors of the polynomial function. Part E Write the equation of the graphed function f(x), where a is the leading coefficient. Use the factors found in part D. Express the function as the product of its leading coefficient and the expanded form of the equation in standard form. Part F Use the y-intercept of the graph and your equation from part E to calculate the value of a. Part G Given what you found in all of the previous parts, write the equation for the function shown in the graph.

Answers: 2


Other questions on the subject: Mathematics
Mathematics, 21.06.2019 16:30, amir6658
Arestaurant gives out a scratch-off card to every customer. the probability that a customer will win a prize from a scratch-off card is 25%. design and conduct a simulation using random numbers to find the experimental probability that a customer will need more than 3 cards in order to win a prize. justify the model for your simulation, and conduct at least 10 trials.
Answers: 1
Mathematics, 21.06.2019 20:30, yeetmaster7688
Find the value of x for which line a is parallel to line b
Answers: 1
Do you know the correct answer?
Polynomials are great functions to use for modeling real-world scenarios where different intervals o...
Questions in other subjects:


Arts, 17.12.2019 22:31


History, 17.12.2019 22:31


