


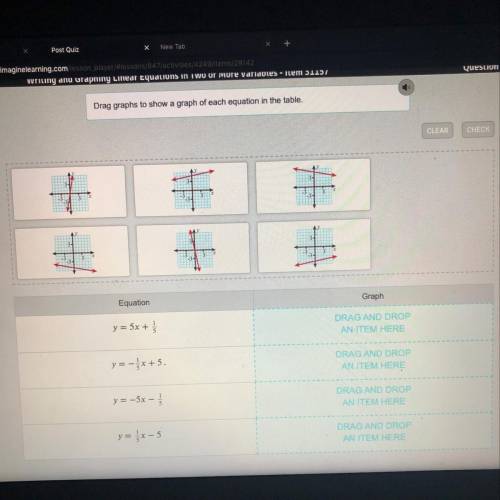
Drag graphs to show a graph of each equation in the table.
Need help please
...

Mathematics, 18.06.2020 21:57, madisonsan9020
Drag graphs to show a graph of each equation in the table.
Need help please

Answers: 3
Other questions on the subject: Mathematics
Mathematics, 22.06.2019 05:50, erin5678
#5 points possible: 3. total attempts: 5 using your calculator, find the range and standard deviation, round to two decimals places: the table below gives the number of hours spent watching tv last week by a sample of 24 children. 76 57 89 73 88 42 31 46 80 42 38 57 49 50 89 36 69 82 27 88 39 89 95 18 range = standard deviation =
Answers: 1
Do you know the correct answer?
Questions in other subjects:


