


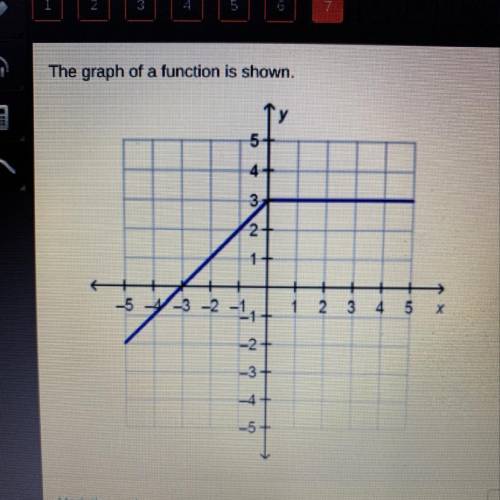
Which function is represented by the graph?
f(x) =
x - 3, x < 0
3. x 20
f(x) =...

Mathematics, 18.06.2020 08:57, charlesrogers38
Which function is represented by the graph?
f(x) =
x - 3, x < 0
3. x 20
f(x) =
x + 3. x < 0
I -x +3, X30
Of(x) =
13,
f(x) =
- x - 3, X50
ch

Answers: 1
Other questions on the subject: Mathematics
Mathematics, 20.06.2019 18:04, putaprincess16
The diagonals of a rhombus are 12 inch and 16 inch long, the length of a side of a rhombus is 10 inch, what is the height of the rhombus
Answers: 1
Mathematics, 21.06.2019 17:00, hsernaykaw42
Use the frequency distribution, which shows the number of american voters (in millions) according to age, to find the probability that a voter chosen at random is in the 18 to 20 years old age range. ages frequency 18 to 20 5.9 21 to 24 7.7 25 to 34 20.4 35 to 44 25.1 45 to 64 54.4 65 and over 27.7 the probability that a voter chosen at random is in the 18 to 20 years old age range is nothing. (round to three decimal places as needed.)
Answers: 1
Mathematics, 21.06.2019 18:00, DominaterDreemurr
In the polynomial below, what number should replace the question mark to produce a difference of squares? x2 + ? x - 36
Answers: 3
Do you know the correct answer?
Questions in other subjects:


Mathematics, 30.07.2020 03:01


