

Mathematics, 17.06.2020 09:57, brandiyocham
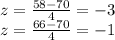
The mean and standard deviation for the heights of men in the U. S. are 70 inches and 4 inches respectively and are normally distributed. Based on this information, which of the following represents the percent of men whose heights falls between 58 inches and 66 inches to the nearest whole percent?
A) 2%
B) 16%
C) 34%
D) 68%

Answers: 2


Other questions on the subject: Mathematics
Mathematics, 21.06.2019 17:10, Andrewecolt1993
Which is a graph of a proportional relationship?
Answers: 1
Mathematics, 21.06.2019 22:30, edgartorres5123
What is 100,000 times 1/100,000, using the standard method of multiplication? write the answer as 10 to a power.
Answers: 1
Mathematics, 22.06.2019 01:10, ceeciliaaa13
|y + 2| > 6 {y|y < -8 or y > 4} {y|y < -6 or y > 6} {y|y < -4 or y > 4}
Answers: 2
Do you know the correct answer?
The mean and standard deviation for the heights of men in the U. S. are 70 inches and 4 inches respe...
Questions in other subjects:


Social Studies, 03.02.2021 01:00
Mathematics, 03.02.2021 01:00


Mathematics, 03.02.2021 01:00


