

Mathematics, 13.06.2020 17:57, Leanylopez0811
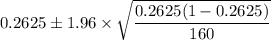
Of a group of randomly selected adults, 360 identified themselves as manual laborers, 280 identified themselves as non-manual wage earners, 250 identified themselves as mid-level managers, and 160 identified themselves as executives. In the survey, 295 of manual laborers preferred trucks, 174 of non-manual wage earners preferred trucks, 135 of mid-level managers preferred trucks, and 42 of executives preferred trucks. We are interested in finding the 95% confidence interval for the percent of executives who prefer trucks.
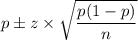
Which distribution should you use for this problem?
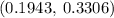
Construct a 95% confidence interval.
State the confidence interval and interpret this result in regards to the context of the problem.

Answers: 1


Other questions on the subject: Mathematics
Mathematics, 21.06.2019 21:30, lilbit217
The map shows the location of the airport and a warehouse in a city. though not displayed on the map, there is also a factory 112 miles due north of the warehouse. a truck traveled from the warehouse to the airport and then to the factory. what is the total number of miles the truck traveled?
Answers: 3
Do you know the correct answer?
Of a group of randomly selected adults, 360 identified themselves as manual laborers, 280 identified...
Questions in other subjects:

English, 19.08.2019 01:30
Mathematics, 19.08.2019 01:30


History, 19.08.2019 01:30
Mathematics, 19.08.2019 01:30
Mathematics, 19.08.2019 01:30
Mathematics, 19.08.2019 01:30


