

Mathematics, 12.06.2020 00:57, KRose3311
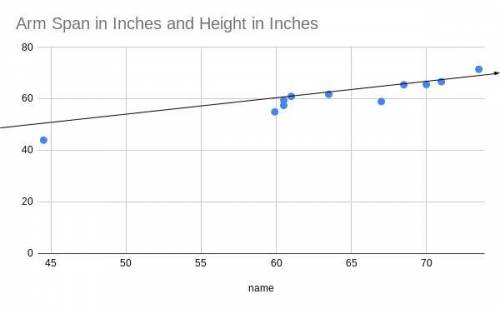
1.) Which variable did you plot on the x-axis, and which variable did you plot on the y-axis? Explain why you assigned the variables in that way.
2.)Write the equation of the line of best fit using the slope-intercept formula y=mx+b. Show all your work, including the points used to determine the slope and how the equation was determined.
3.) What does the slope of the line represent within the context of your graph? What does the y-intercept represent?
Test the residuals of two other points to determine how well the line of best fit models the data.
Use the line of best fit to help you to describe the data correlation.
Using the line of best fit that you found in Part Three, Question 2, approximate how tall is a person whose arm span is 66 inches?
According to your line of best fit, what is the arm span of a 74-inch-tall person?

Answers: 2


Other questions on the subject: Mathematics
Mathematics, 21.06.2019 16:00, michellealvarez985
Quadrilateral wxyz is on a coordinate plane. segment yz is on the line x+y=7 and segment xw is on the line x+y=3. which statement proves how segments yz and xw are related
Answers: 1
Mathematics, 21.06.2019 20:30, elenaabad18
Ateacher brought a pack of 17 batteries . each calculator uses 3 batteries . how many calculator can the teacher fill with batteries
Answers: 2
Mathematics, 21.06.2019 21:00, manasangreddy2921
Simplify -4z+2y-y+-18z a.-22z+y b.-14z+2 c.3y+22z d. y +14z
Answers: 1
Mathematics, 22.06.2019 00:30, vladisking888
How can you find the magnitude of a vector, v = < x, y > , where the horizontal change is x and the vertical change is y?
Answers: 1
Do you know the correct answer?
1.) Which variable did you plot on the x-axis, and which variable did you plot on the y-axis? Explai...
Questions in other subjects:

Business, 20.10.2019 14:00
Mathematics, 20.10.2019 14:00

English, 20.10.2019 14:00


Biology, 20.10.2019 14:00

Social Studies, 20.10.2019 14:00

Chemistry, 20.10.2019 14:00


